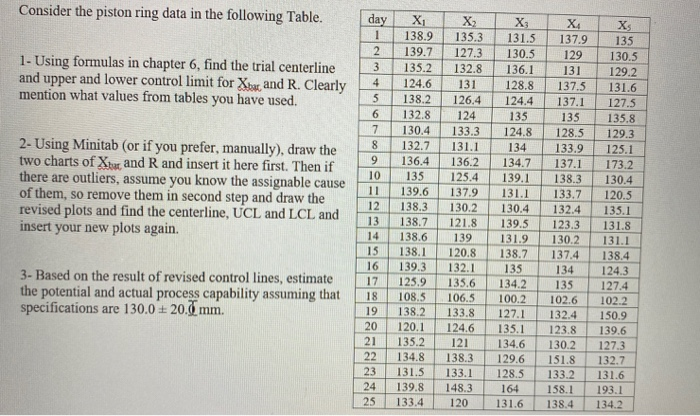
Question: Consider the piston ring data in the following Table. 1. Using formulas in chapter 6, find the trial centerline and upper and lower control limit

Consider the piston ring data in the following
Consider the piston ring data in the following Table. 1. Using formulas in chapter 6, find the trial centerline and upper and lower control limit for Xbar and R. Clearly mention what values from tables you have used. 2- Using Minitab (or if you prefer, manually), draw the two charts of Xhar and R and insert it here first. Then if there are outliers, assume you know the assignable cause of them, so remove them in second step and draw the revised plots and find the centerline, UCL and LCL and insert your new plots again. day XXXXX 1138. 9135. 3131.5 137.9 2 139.7 127.3 130. 5 1291305 3. 135.2 132.8 136.1 131 129.2 4 124.6 131 128.8 137.5 131.6 138.2 126.4 124.4 137.1 127.5 6 132. 8 124 135 135 135.8 7 1 30.4 133.3 124.8 128.5 129.3 8 132.7 131. 1 134133.9 125.1 9 136.4 136. 2 134.7 137.1 173.2 10135125.4 139.1 138.3 130.4 11139.6 137.9 1311 133.7 120.5 12 138.3 130.2 130.4 132.4 135.1 13 138.7 121.8 139.5 123.3 131.8 14 138.6 139131. 9 130.2 131.1 15138.1 120. 8 138.7 137.4 138.4 16139.3 132. 1 135 134 124.3 17 125,9 135.6 134. 2 135127.4 18 108.5 106.5 100.2 102.6 102.2 19 138. 2 133.8 127.1 132.4 150.9 20 120.1 124.6 135.1 123.8 139.6 21 135.2 121 134.6 130.2 127.3 22 134.8 138.3 129.6 151.8 132.7 131.5 133.1 128.5 133. 2 131.6 24 139.8 148.3 164 158.1 193.1 3- Based on the result of revised control lines, estimate the potential and actual process capability assuming that specifications are 130.0 20.0 mm. 23 Consider the piston ring data in the following Table. 1. Using formulas in chapter 6, find the trial centerline and upper and lower control limit for Xbar and R. Clearly mention what values from tables you have used. 2- Using Minitab (or if you prefer, manually), draw the two charts of Xhar and R and insert it here first. Then if there are outliers, assume you know the assignable cause of them, so remove them in second step and draw the revised plots and find the centerline, UCL and LCL and insert your new plots again. day XXXXX 1138. 9135. 3131.5 137.9 2 139.7 127.3 130. 5 1291305 3. 135.2 132.8 136.1 131 129.2 4 124.6 131 128.8 137.5 131.6 138.2 126.4 124.4 137.1 127.5 6 132. 8 124 135 135 135.8 7 1 30.4 133.3 124.8 128.5 129.3 8 132.7 131. 1 134133.9 125.1 9 136.4 136. 2 134.7 137.1 173.2 10135125.4 139.1 138.3 130.4 11139.6 137.9 1311 133.7 120.5 12 138.3 130.2 130.4 132.4 135.1 13 138.7 121.8 139.5 123.3 131.8 14 138.6 139131. 9 130.2 131.1 15138.1 120. 8 138.7 137.4 138.4 16139.3 132. 1 135 134 124.3 17 125,9 135.6 134. 2 135127.4 18 108.5 106.5 100.2 102.6 102.2 19 138. 2 133.8 127.1 132.4 150.9 20 120.1 124.6 135.1 123.8 139.6 21 135.2 121 134.6 130.2 127.3 22 134.8 138.3 129.6 151.8 132.7 131.5 133.1 128.5 133. 2 131.6 24 139.8 148.3 164 158.1 193.1 3- Based on the result of revised control lines, estimate the potential and actual process capability assuming that specifications are 130.0 20.0 mm. 23

Step by Step Solution

There are 3 Steps involved in it

1 Expert Approved Answer
Step: 1 Unlock blur-text-image
Question Has Been Solved by an Expert!

Get step-by-step solutions from verified subject matter experts

Step: 2 Unlock
Step: 3 Unlock

Students Have Also Explored These Related General Management Questions!