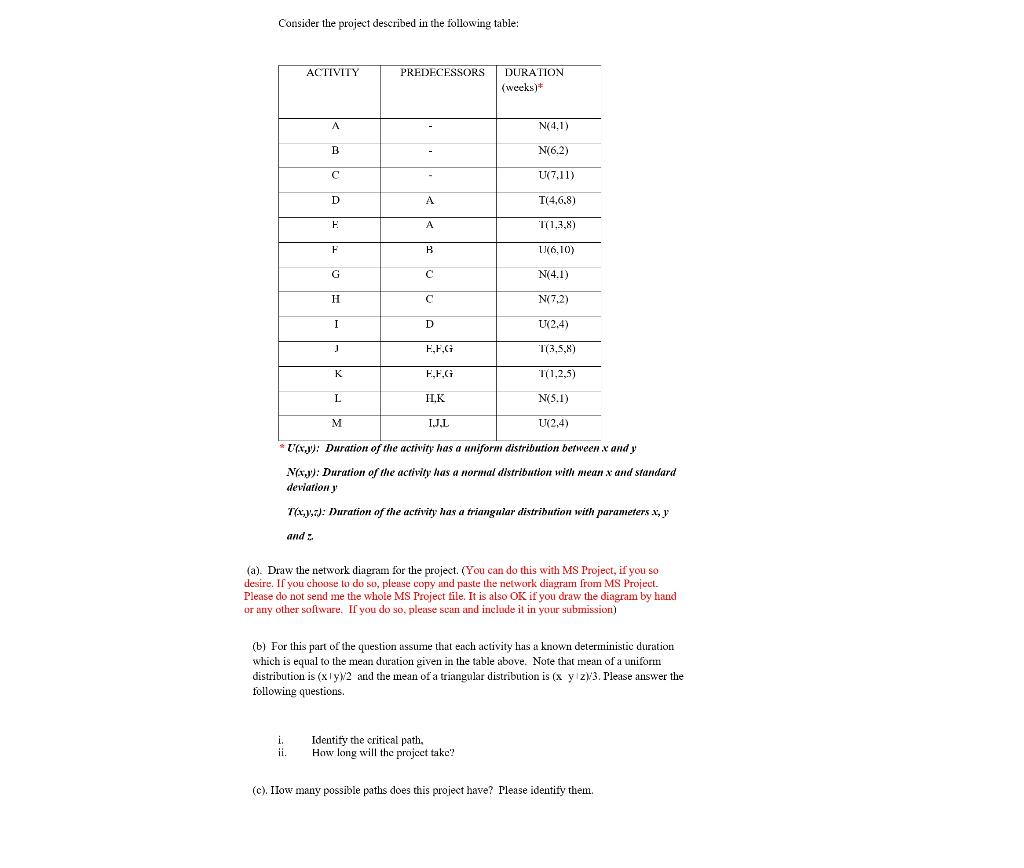
Question: Consider the project described in the following table: ACTIVITY PREDECESSORS DURATION (weeks) A N(4.1) B N(6.2) C U(7,11) D A T(4,6,8) E A 171.3,8) F

Consider the project described in the following

Consider the project described in the following table: ACTIVITY PREDECESSORS DURATION (weeks) A N(4.1) B N(6.2) C U(7,11) D A T(4,6,8) E A 171.3,8) F B B 1(6.10) G C C N(4.1) H H N(7.2) I I D U(2.4) j E.F.G 113,5,8) K E,F,G 1/1,2,5) L H.K N(5.1) M IJL U(2,4) * U(x,y): Duration of the activity has a nniform distribution between x and y N(x,): Duration of the activity has a normal distribution with mear x and standard deviation y T(x,y,z): Duration of the activity has a triangular distribution with parameters x, y and : (a). Draw the network diagram for the project. (You can do this with MS Project, if you so desire. If you choose to do su, please copy and paste the network diagram from MS Project Please do not send me the whole MS Project file. It is also OK if you draw the diagram by hand or any other software. If you do so, please scan and include it in your submission) (b) For this part of the question assume that each activity has a known deterministic duration which is equal to the mean duration given in the table above. Note that mean of a uniform distribution is (x y12 and the mean of a triangular distribution is (x y zw3. Please answer the following questions. i. ii. Identify the critical path, How long will the project take? (c). Ilow many possible paths does this project have? Please identify them

Step by Step Solution

There are 3 Steps involved in it

1 Expert Approved Answer
Step: 1 Unlock blur-text-image
Question Has Been Solved by an Expert!

Get step-by-step solutions from verified subject matter experts

Step: 2 Unlock
Step: 3 Unlock

Students Have Also Explored These Related General Management Questions!