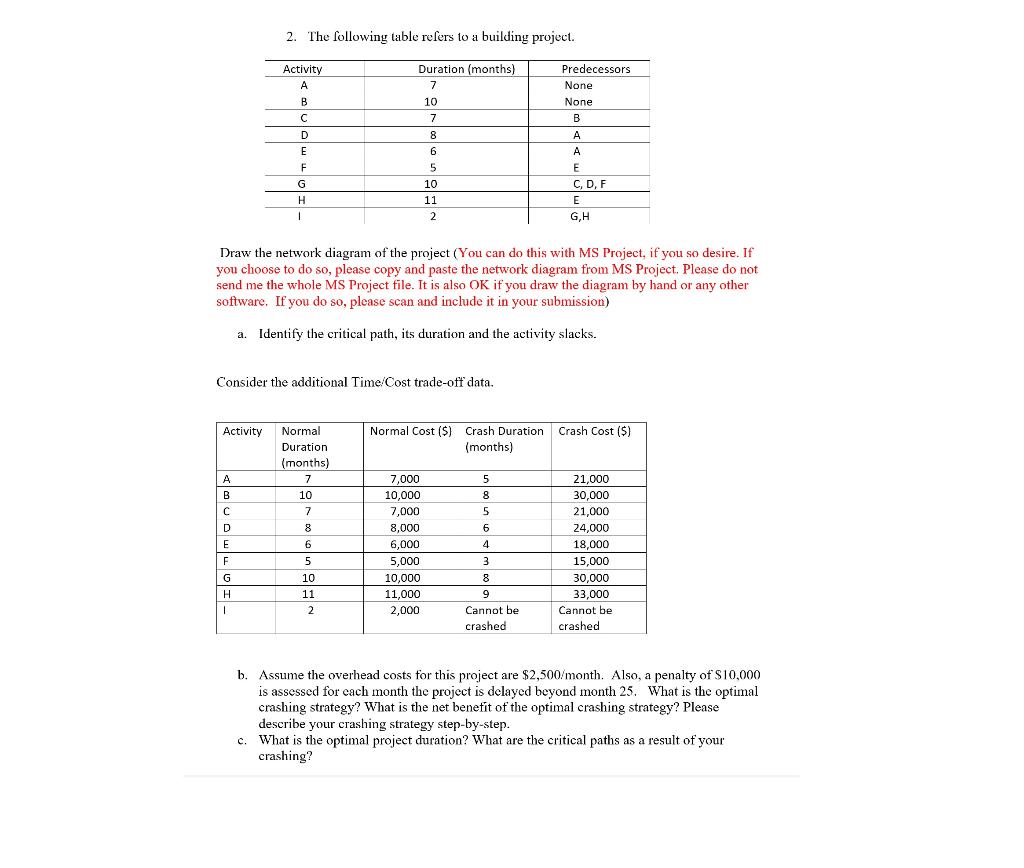
Question: 2. The following table refers to a building project. Activity A B D Duration (months) 7 10 7 8 6 5 10 11 2 Predecessors

2. The following table refers to a building

2. The following table refers to a building project. Activity A B D Duration (months) 7 10 7 8 6 5 10 11 2 Predecessors None None B A A E CDF E GH E F G H 1 Draw the network diagram of the project (You can do this with MS Project, if you so desire. If you choose to do so, please copy and paste the network diagram from MS Project. Please do not send me the whole MS Project file. It is also OK if you draw the diagram by hand or any other software. If you do so, please scan and include it in your submission) a. a. Identify the critical path, its duration and the activity slacks. Consider the additional Time/Cost trade-off data. Activity Crash Cost ($) Normal Cost ($) Crash Duration (months) A B B 5 5 8 5 C Normal Duration (months) 7 10 10 7 8 6 5 10 11 2 D 6 E 7,000 10,000 7,000 8,000 6,000 5,000 10,000 11,000 2,000 4 21,000 30,000 21,000 24,000 100 18.000 15,000 30,000 33,000 Cannot be crashed F 3 G 1 8 9 Cannot be crashed b. Assume the overhead costs for this project are $2,500/month. Also, a penalty of $10,000 is assessed for cach month the project is delayed beyond month 25. What is the optimal crashing strategy? What is the net benefit of the optimal crashing strategy? Please describe your crashing strategy step-by-step. c. What is the optimal project duration? What are the critical paths as a result of your crashing

Step by Step Solution

There are 3 Steps involved in it

1 Expert Approved Answer
Step: 1 Unlock blur-text-image
Question Has Been Solved by an Expert!

Get step-by-step solutions from verified subject matter experts

Step: 2 Unlock
Step: 3 Unlock

Students Have Also Explored These Related General Management Questions!