

Question
Consider the system of Figure P2a, a. Determine a nonlinear state model for the system with x=y and x = 1 R(s) *Q (%)
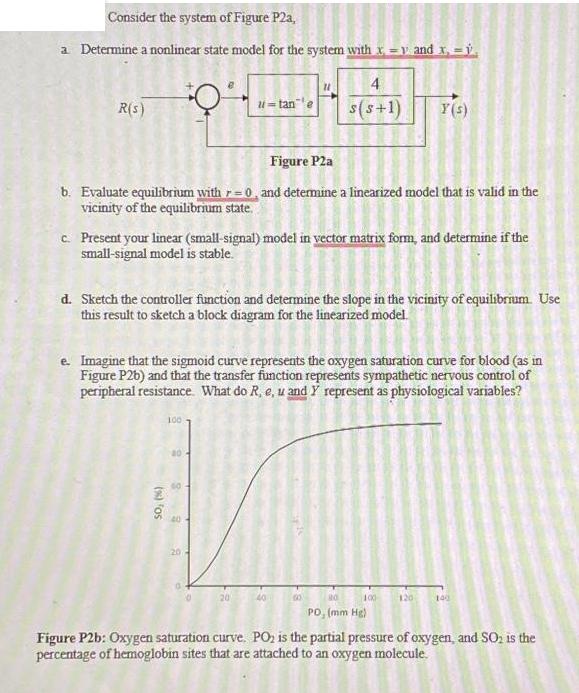
Consider the system of Figure P2a, a. Determine a nonlinear state model for the system with x=y and x = 1 R(s) *Q (%) Fos Figure P2a b. Evaluate equilibrium with = 0, and determine a linearized model that is valid in the vicinity of the equilibrium state. 100 u=tan c. Present your linear (small-signal) model in vector matrix form, and determine if the small-signal model is stable. 40 d. Sketch the controller function and determine the slope in the vicinity of equilibrium. Use this result to sketch a block diagram for the linearized model. 20 e. Imagine that the sigmoid curve represents the oxygen saturation curve for blood (as in Figure P2b) and that the transfer function represents sympathetic nervous control of peripheral resistance. What do R, e, u and y represent as physiological variables? 11 4 20 s(s+1) 40 00 Y(s) 80 PO, (mm Hg) 100 120 Figure P2b: Oxygen saturation curve. PO is the partial pressure of oxygen, and SO is the percentage of hemoglobin sites that are attached to an oxygen molecule.
Step by Step Solution
3.40 Rating (134 Votes )
There are 3 Steps involved in it
Step: 1
a The nonlinear state space model is x1dot x2 x2dot u x2 Where x1 v x2 gamma dot a...
Get Instant Access with AI-Powered Solutions
See step-by-step solutions with expert insights and AI powered tools for academic success
Step: 2

Step: 3
Ace Your Homework with AI
Get the answers you need in no time with our AI-driven, step-by-step assistance
Get Started
Control Systems Engineering
Authors: Norman S. Nise
7th Edition
1118170512, 978-1118170519