

Question: Consider this data about COVID-19 from a certain city. Use a spreadsheet to do the following: a) Make a table with Weeks since 10th Case
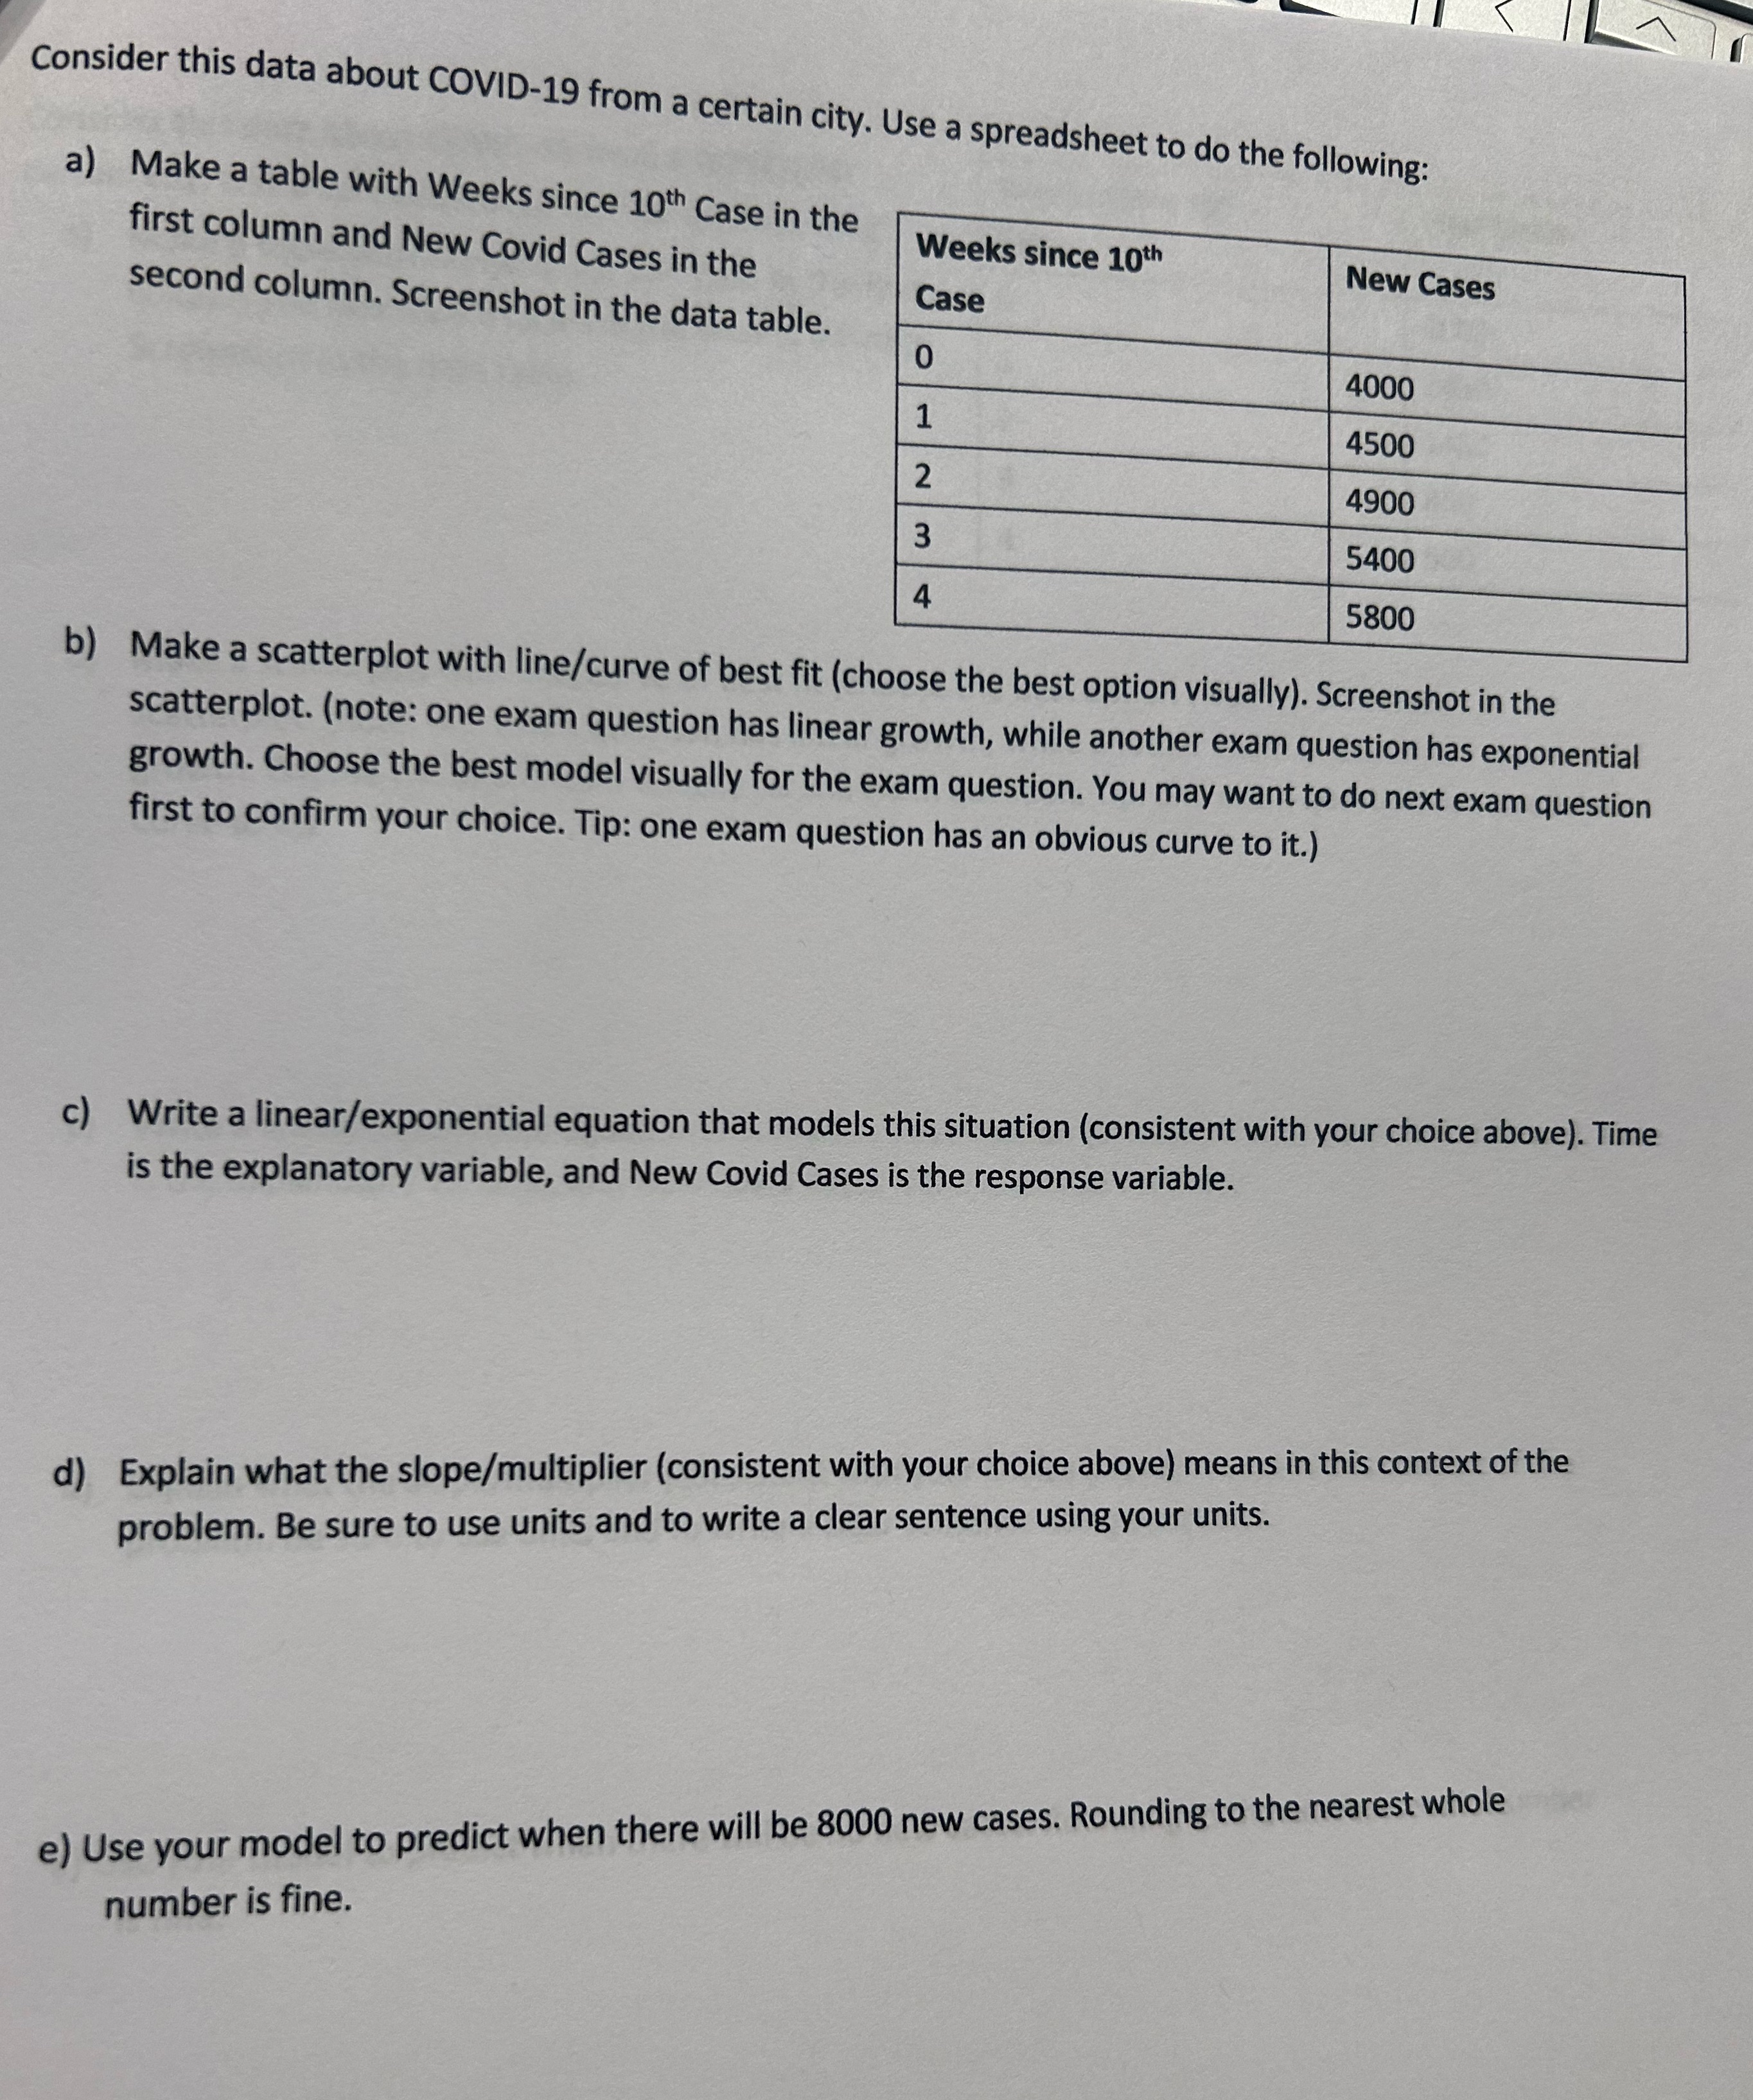
Consider this data about COVID-19 from a certain city. Use a spreadsheet to do the following: a) Make a table with Weeks since 10th Case in the first column and New Covid Cases in the Weeks since 10th New Cases second column. Screenshot in the data table. Case 0 4000 1 4500 2 4900 3 5400 5800 b) Make a scatterplot with line/curve of best fit (choose the best option visually). Screenshot in the scatterplot. (note: one exam question has linear growth, while another exam question has exponential growth. Choose the best model visually for the exam question. You may want to do next exam question first to confirm your choice. Tip: one exam question has an obvious curve to it.) c) Write a linear/exponential equation that models this situation (consistent with your choice above). Time is the explanatory variable, and New Covid Cases is the response variable. d) Explain what the slope/multiplier (consistent with your choice above) means in this context of the problem. Be sure to use units and to write a clear sentence using your units. e) Use your model to predict when there will be 8000 new cases. Rounding to the nearest whole number is fine
Step by Step Solution
There are 3 Steps involved in it

Get step-by-step solutions from verified subject matter experts