

Question: Consider two classification concepts given in Figure 1, where x = [-6,6] x -4,4, y={-1, +1} and p(yr) = {0,1} is defined in the
![Consider two classification concepts given in Figure 1, where x = [-6,6]](https://dsd5zvtm8ll6.cloudfront.net/questions/2024/04/6614db0d2a1a7_1712646327697.jpg)
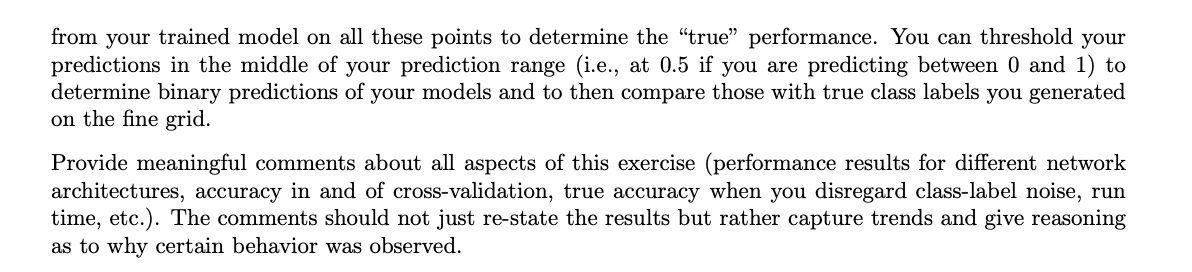
Consider two classification concepts given in Figure 1, where x = [-6,6] x -4,4, y={-1, +1} and p(yr) = {0,1} is defined in the drawing. A) 4 (-4,3) + (2, 1) - 0 (-2, -1) + + B) 4 (-4, 3) 0 (-1,-2) (2, 0) + 0 6 0 Figure 1: Two concepts where examples that fall within any of the three 3 x 3 (panel A) or 1 x 1 (panel B) squares are labeled positive and the remaining examples (outside each of the squares but within X) are labeled negative. The position of the point x=(1, 2) in the upper left-hand corner for each square is shown in the picture. Consider horizontal axis to be 21 and vertical axis as 22. Your experiments in this question will rely on generating a data set of size n = {250, 1000, 10000} drawn from a uniform distribution in X and labeled according to the rules from Figure 1; e.g., P(Y = 1x) = 0.99 if x that was randomly drawn is inside any of the three squares in either of the two panels, and P(Y = 1|x) = 0.03 otherwise (notice that this introduces a certain amount of asymmetric noise in the data). The goal of the following two problems will be to train and evaluate classifiers created from the data generated in this way. You can use any library you want in this assignment and do programming in Python, MATLAB, or R. Your code should be easy to run for each question and sub-question below so that we can replicate your results to the maximum extent possible. Consider single-output feed-forward neural networks with one or two hidden layers such that the number of hidden neurons in each layer is h = {1, 4, 12} and h = {0, 3}, respectively, with h = 0 meaning that there is no second hidden layer. Consider one of the standard objective functions as your optimization criterion and use early stopping and regularization as needed. Consider a hyperbolic tangent activation function in each neuron and the output but you are free to experiment with others if you'd like to. For each of the architectures, defined by a parameter combination (h1, h2), evaluate the performance of each model using classification accuracy, balanced accuracy, and area under the ROC curve as your performance criteria. To evaluate the performance of your models use cross-validation. However, to evaluate the performance of performance evaluation, generate another very large data set on a fine grid in X. Then use the predictions from your trained model on all these points to determine the "true" performance. You can threshold your predictions in the middle of your prediction range (i.e., at 0.5 if you are predicting between 0 and 1) to determine binary predictions of your models and to then compare those with true class labels you generated on the fine grid. Provide meaningful comments about all aspects of this exercise (performance results for different network architectures, accuracy in and of cross-validation, true accuracy when you disregard class-label noise, run time, etc.). The comments should not just re-state the results but rather capture trends and give reasoning as to why certain behavior was observed.
Step by Step Solution
There are 3 Steps involved in it

Get step-by-step solutions from verified subject matter experts