

Question: Consoder the data contained in the table below, which lists 30 monthly excess returns to two diferent actively managed stock portfolios (A and B) and
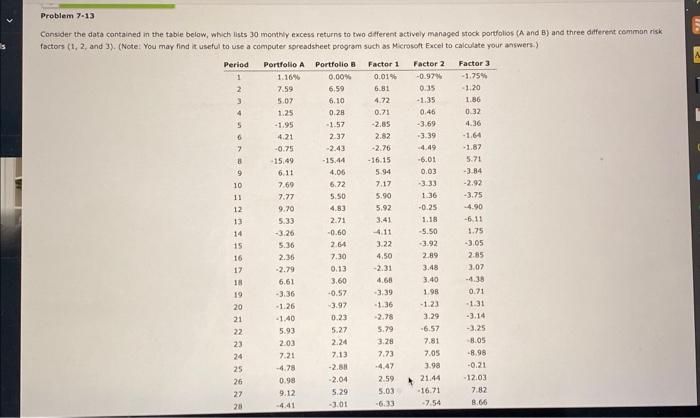
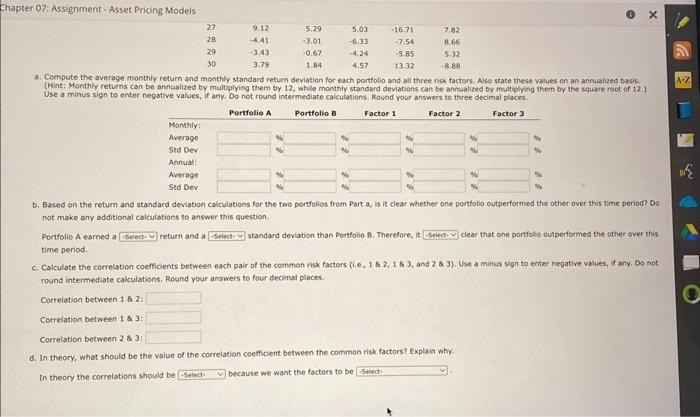
Consoder the data contained in the table below, which lists 30 monthly excess returns to two diferent actively managed stock portfolios (A and B) and three different comman risk a. Compute the average monthly return and monthly standard return deviation for each portfolio and all three risk factors, Alse state these values on an annualized basis. Use a minus sign to enter negative values, if any, Do not round intermediate calculations. Round your answers to three decimal places. b. Based on the return and standard deviation calculations for the two portfolios from Part a, is it dear whether one pertfolio outperformed the other over this time period? Do not make any additional calculations to answer this question. Poctfolio A eamed a return and a standard deviation than Portfolio B. Therefore, it clear that one portfolio outperformed the other over this time period. c. Caiculate the correlation coefficients between each pair of the common risk factors (i.e, 182,183 , and 283 ). Use a minus sign to enter negative values, if any, Do not. round intermediate calculations. Round your answers to four decimal places. Correlation between 1 \& 2 : Correlation between 1&3 : Correlation between 2:3 : d. In theory, what should be the value of the correlation coefficient between the common risk factors? Explain why. In theory the correlations should be because we want the factors to be
Step by Step Solution
There are 3 Steps involved in it

Get step-by-step solutions from verified subject matter experts