

Question: ? Constants I Periodic Table Part A (Figure 1) shows a graph of ponition as a function of time for an object moving along a
?
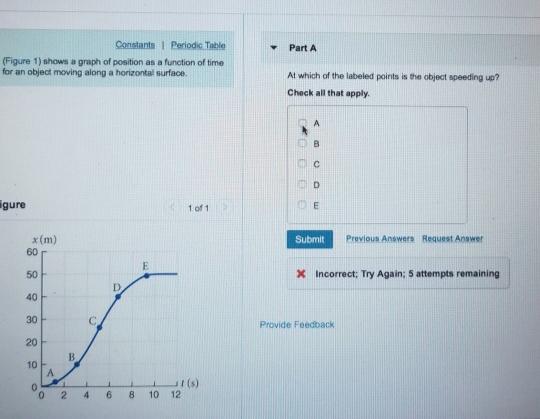
Constants I Periodic Table Part A (Figure 1) shows a graph of ponition as a function of time for an object moving along a horizontal surface. At which of the labeled points is the object speeding up? Check all that apply. igure 1 of 1 Submit Previous Answers Request Answer x(m) 60 50 X Incorrect; Try Again; 5 attempts remaining D 40 30 Provide Feedback 20 B. 10 2 4 6 8. 10 12
Step by Step Solution
★★★★★
3.46 Rating (159 Votes )
There are 3 Steps involved in it
1 Expert Approved Answer
Step: 1 Unlock

The slope of the graph between position and time indica... View full answer
Question Has Been Solved by an Expert!
Get step-by-step solutions from verified subject matter experts
Step: 2 Unlock
Step: 3 Unlock