

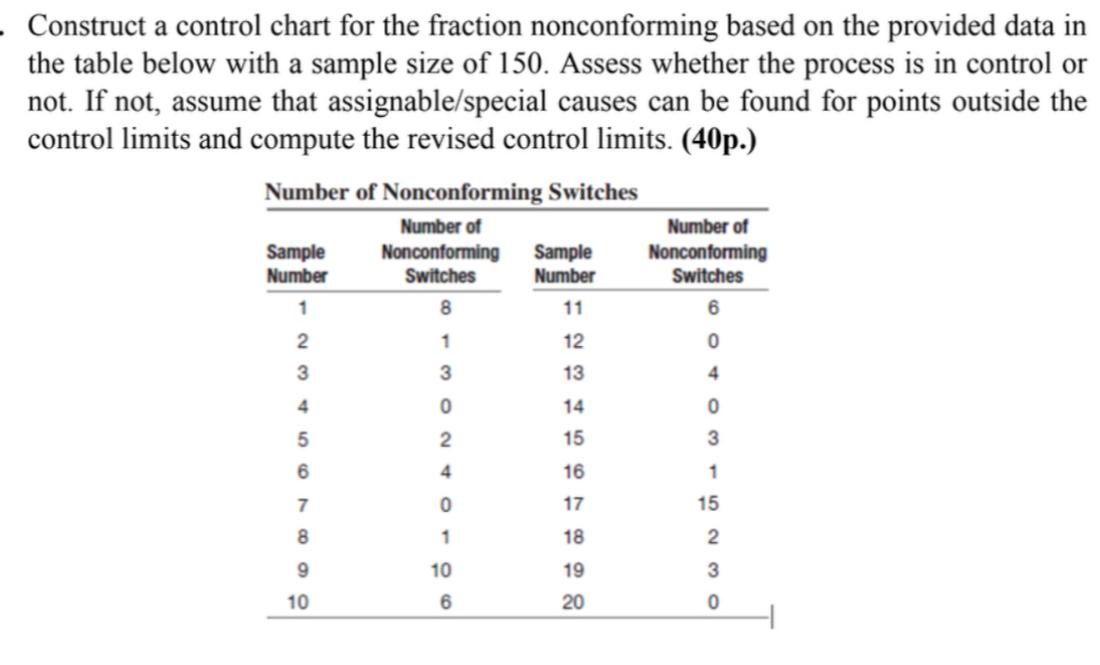
Question: Construct a control chart for the fraction nonconforming based on the provided data in the table below with a sample size of 1 5 0
Construct a control chart for the fraction nonconforming based on the provided data in the table below with a sample size of Assess whether the process is in control or not. If not, assume that assignablespecial causes can be found for points outside the control limits and compute the revised control limitsp
Number of Nonconforming Switches
tableSampletableNumber ofNonconformingSwitchestableSampleNumbertableNumber ofNonconformingSwitches
Step by Step Solution
There are 3 Steps involved in it
1 Expert Approved Answer
Step: 1 Unlock

Question Has Been Solved by an Expert!
Get step-by-step solutions from verified subject matter experts
Step: 2 Unlock
Step: 3 Unlock