

Question: Construct a security market line graph and plot the expected return of each investment on the graph. How do you find the risk free rate,
Construct a security market line graph and plot the expected return of each investment on the graph. 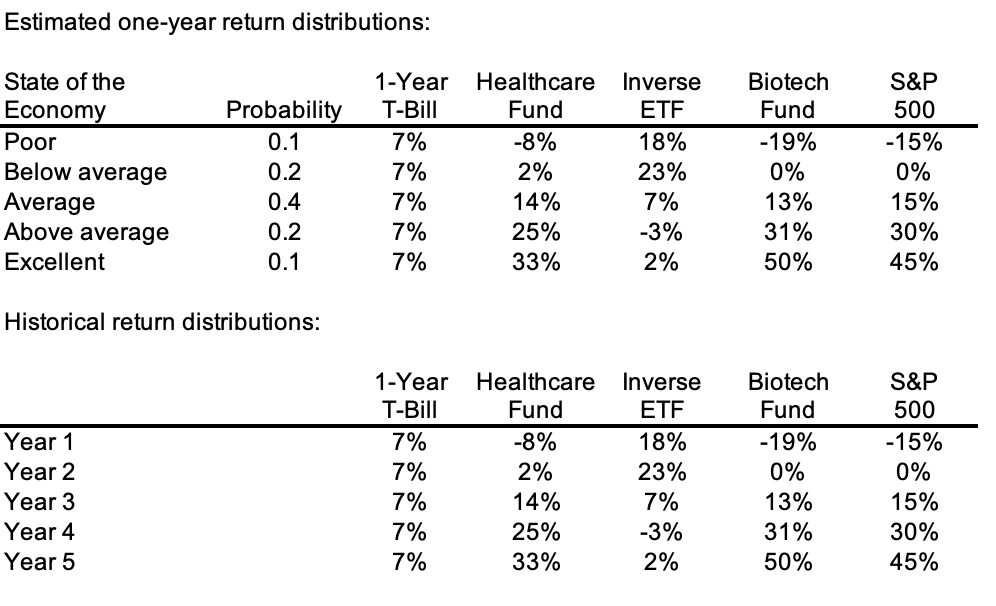
How do you find the risk free rate, required return on investment, and required return on market? I found the beta values for each investment by constructing corporate charcteristic lines.
Estimated one-year return distributions: State of the Economy Poor Below average Average Above average Excellent Probability 0.1 0.2 0.4 1-Year Health care T-Bill Fund 7% -8% 7% 2% 7% 14% 25% 33% Inverse ETF 18% 23% 7% -3% 2% Biotech Fund -19% 0% 13% 31% 50% S&P 500 -15% 0% 15% 30% 45% 0.2 7% 0.1 7% Historical return distributions: Year 1 Year 2 Year 3 Year 4 Year 5 1-Year Healthcare T-Bill Fund 7% -8% 7% 2% 7% 14% 25% 33% Inverse ETF 18% 23% 7% -3% 2% Biotech Fund -19% 0% 13% 31% 50% S&P 500 -15% 0% 15% 30% 45% 7% 7%
Step by Step Solution
There are 3 Steps involved in it

Get step-by-step solutions from verified subject matter experts