

Question: This discussion is on Pink Chapter 12. Use the excel spreadsheet associated with this chapter in your response. Your response should have 500+ words. You
This discussion is on Pink Chapter 12. Use the excel spreadsheet associated with this chapter in your response. Your response should have 500+ words. You may include screenshots/images of your excel formulas/calculations.
1. Compare the stand-alone risk/expected return of each of the four investments and the S&P 500 listed in exhibit 12.1.
2. MSI is considering two investment strategies:- 50 percent in Healthcare Fund and 50 percent in Inverse ETF- 50 percent in Healthcare Fund and 50 percent in Biotech FundCompare the risk of the two portfolios. Why does the risk differ?
3.
- a. Use the historical returns in exhibit 12.2 to create a graph with market characteristic lines for a 1-year T-Bill, Healthcare Fund, Inverse ETF, and Biotech Fund. Compare the market risk of each of the four investments.
- b. What would happen to the overall risk of a well-diversified portfolio with an investment in a 1-Year T-Bill? Healthcare Fund? Inverse ETF? Biotech Fund?
4.
- a. Construct a Security Market Line graph and plot the expected return of each investment on the graph.
- b. If you were an individual investor with a well-diversified portfolio, which investment(s) in exhibit 12.1 would you buy? Why?
- c. What does the distance between the Security Market Line and the expected return of an investment indicate?
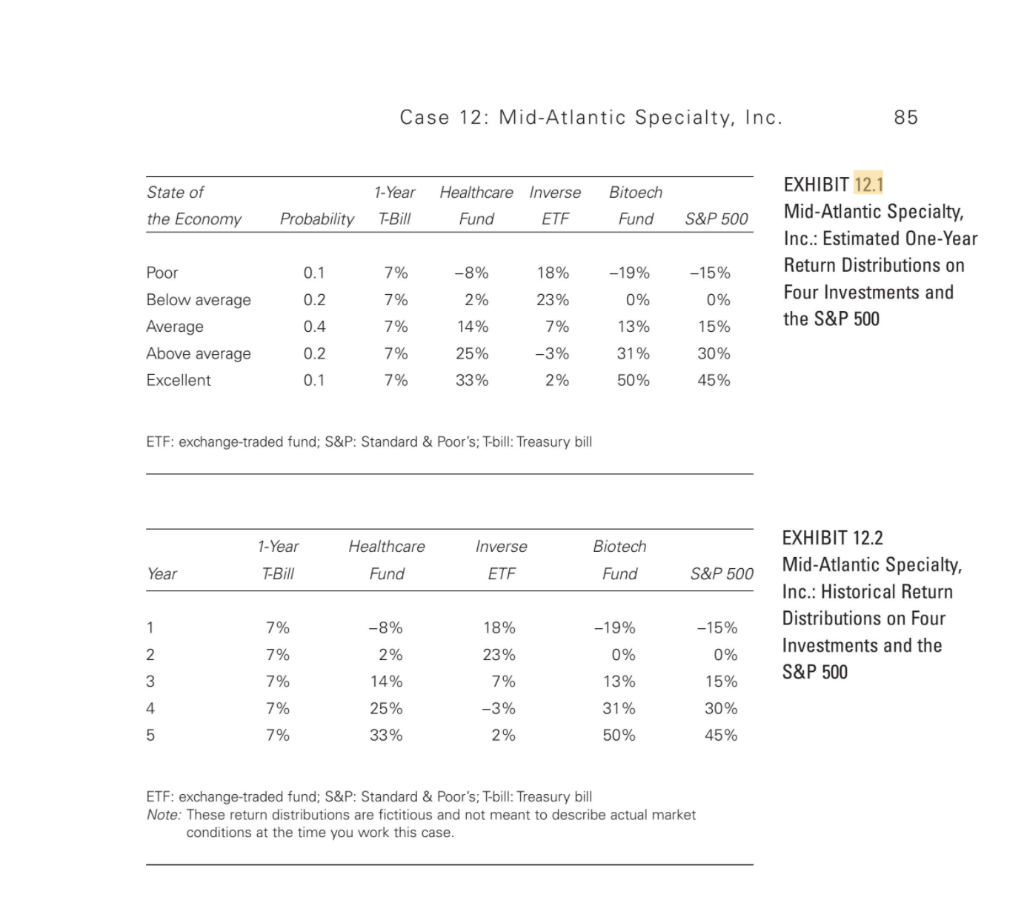
Case 12: Mid-Atlantic Specialty, Inc. 85 State of the Economy 1-Year T-Bill Healthcare Inverse Fund ETF Bitoech Fund Probability S&P 500 EXHIBIT 12.1 Mid-Atlantic Specialty, Inc.: Estimated One-Year Return Distributions on Four Investments and the S&P 500 0.1 7% 18% -15% -8% 2% -19% 0% 0.2 7% 23% 0% Poor Below average Average Above average Excellent 0.4 7% 14% 7% 13% 15% 0.2 7% 31% 25% 33% -3% 2% 30% 45% 0.1 7% 50% ETF: exchange-traded fund; S&P: Standard & Poor's; T-bill: Treasury bill 1-Year Inverse Healthcare Fund Biotech Fund Year T-Bill ETF S&P 500 EXHIBIT 12.2 Mid-Atlantic Specialty, Inc.: Historical Return Distributions on Four Investments and the S&P 500 1 7% -8% 18% -19% -15% 2 0% 2% 14% 0% 13% 3 15% 7% 7% 7% 7% 23% 7% -3% 2% 4 25% 33% 31% 50% 30% 45% 5 ETF: exchange-traded fund; S&P: Standard & Poor's; T-bill: Treasury bill Note: These return distributions are fictitious and not meant to describe actual market conditions at the time you work this case. Case 12: Mid-Atlantic Specialty, Inc. 85 State of the Economy 1-Year T-Bill Healthcare Inverse Fund ETF Bitoech Fund Probability S&P 500 EXHIBIT 12.1 Mid-Atlantic Specialty, Inc.: Estimated One-Year Return Distributions on Four Investments and the S&P 500 0.1 7% 18% -15% -8% 2% -19% 0% 0.2 7% 23% 0% Poor Below average Average Above average Excellent 0.4 7% 14% 7% 13% 15% 0.2 7% 31% 25% 33% -3% 2% 30% 45% 0.1 7% 50% ETF: exchange-traded fund; S&P: Standard & Poor's; T-bill: Treasury bill 1-Year Inverse Healthcare Fund Biotech Fund Year T-Bill ETF S&P 500 EXHIBIT 12.2 Mid-Atlantic Specialty, Inc.: Historical Return Distributions on Four Investments and the S&P 500 1 7% -8% 18% -19% -15% 2 0% 2% 14% 0% 13% 3 15% 7% 7% 7% 7% 23% 7% -3% 2% 4 25% 33% 31% 50% 30% 45% 5 ETF: exchange-traded fund; S&P: Standard & Poor's; T-bill: Treasury bill Note: These return distributions are fictitious and not meant to describe actual market conditions at the time you work this case
Step by Step Solution
There are 3 Steps involved in it

Get step-by-step solutions from verified subject matter experts