

Question: Construct a time series graph for the years 2007 to 2010 showing the number of rental cars in service for each company. Show the time
Construct a time series graph for the years 2007 to 2010 showing the number of rental cars in service for each company. Show the time series for all three companies on the same graph.
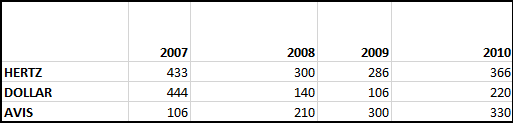
HERTZ DOLLAR AVIS 2007 433 444 106 2008 300 140 210 2009 286 106 300 2010 366 220 330Step by Step Solution
There are 3 Steps involved in it
1 Expert Approved Answer
Step: 1 Unlock

Question Has Been Solved by an Expert!
Get step-by-step solutions from verified subject matter experts
Step: 2 Unlock
Step: 3 Unlock