

Question: Construct an Excel sheet with two stocks from the table above. Construct the variance covariance matrix of the two stocks. Next, find the expected return
Construct an Excel sheet with two stocks from the table above. Construct the variance covariance matrix of the two stocks. Next, find the expected return and standard deviation of the portfolio for 100 different weights. You can start with = 1 and = 0 and change the weight by 0.01 to obtain 100 different weights and consequently 100 different risk and return observations. Plot this on a scatterplot with return on the y-axis and standard deviation on the x-axis. Repeat this for different correlations between +1 to 1 on the same graph.
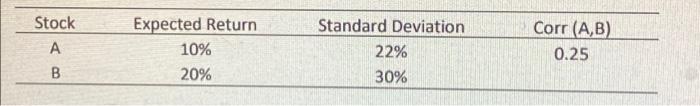
Stock A B Expected Return 10% 20% Standard Deviation 22% 30% Corr (A,B) 0.25 Stock A B Expected Return 10% 20% Standard Deviation 22% 30% Corr (A,B) 0.25
Step by Step Solution
There are 3 Steps involved in it

Get step-by-step solutions from verified subject matter experts