

Question: Construct mean and range chart for the following: A quality inspector took ten samples, each with five observations, of the length of time for paint
Construct mean and range chart for the following:
A quality inspector took ten samples, each with five observations, of the length of time for paint to dry. The analyst computed the mean of each sample and then computed the grand mean. All values are in minutes. Use this information to obtain three-sigma (i.e., z = 3) control limits for the means of future time. It is known from previous experience that the standard deviation of the process is 0.06 minute.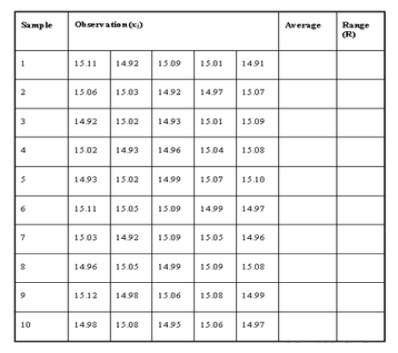
Step by Step Solution
There are 3 Steps involved in it
1 Expert Approved Answer
Step: 1 Unlock

Question Has Been Solved by an Expert!
Get step-by-step solutions from verified subject matter experts
Step: 2 Unlock
Step: 3 Unlock