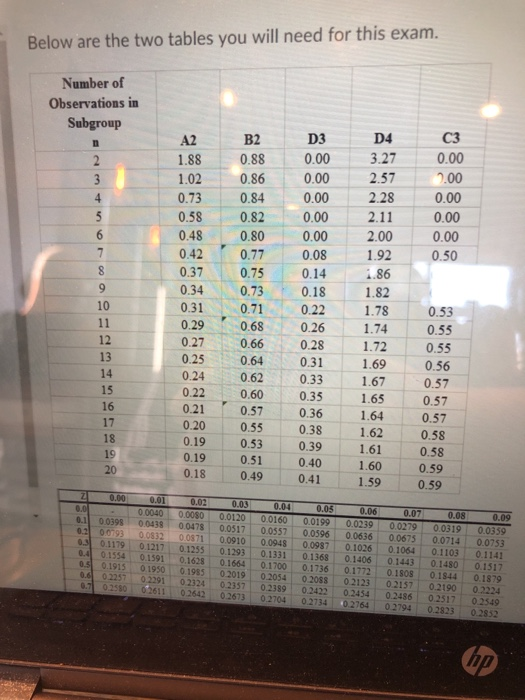
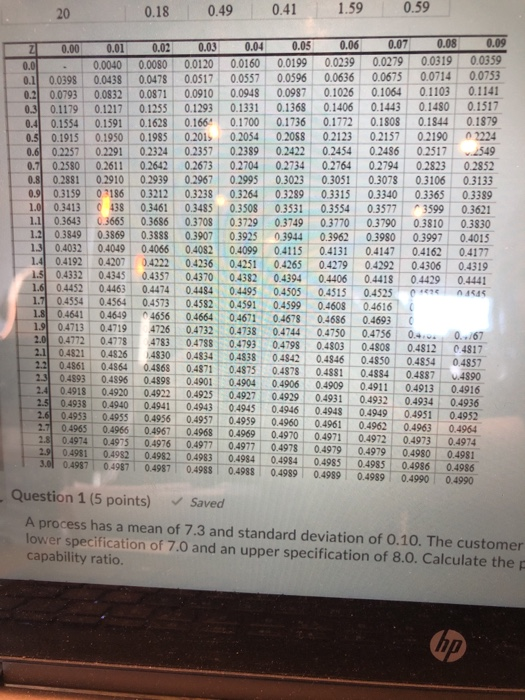
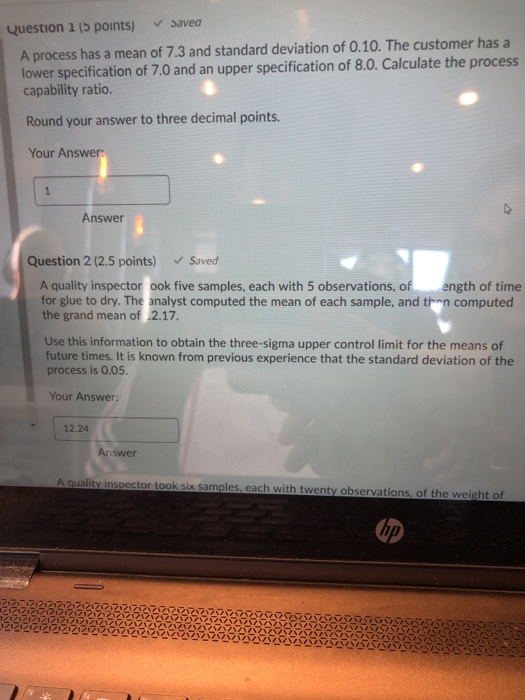
Question: Below are the two tables you will need for this exam. Number of Observations in Subgroup D3 C3 0.00 0.00 2.00 1.88 1.02 0.73 0.58

Below are the two tables you will need for this
Below are the two tables you will need for this exam. Number of Observations in Subgroup D3 C3 0.00 0.00 2.00 1.88 1.02 0.73 0.58 0.48 0.00 0.00 0.00 0.50 0.42 0.37 0.34 0.31 0.29 0.27 0.25 0.24 0.22 0.21 0.20 0.19 0.19 0.18 B2 0.88 0.86 0.84 0.82 0.80 0.77 0.75 0.73 0.71 0.68 0.66 0.64 0.62 0.60 0.57 0.55 0.53 0.51 0.49 0.00 0.00 0.00 0.00 0.08 0.14 0.18 0.22 0.26 0.28 0.31 0.33 0.35 0.36 0.38 0.39 0.40 0.41 D4 3.27 2.57 2.28 2.11 2.00 1.92 1.86 1.82 1.78 1.74 1.72 1.69 1.67 1.65 1.64 1.62 1.61 1.60 1.59 0.53 0.55 0.55 0.56 0.57 0.57 0.57 0.58 0.58 0.59 0.59 18 20 2 0 .00 0.01 0.02 000400.0080 0.1 0.0393 0.0438 0.0478 0.2 0.0193 0.033200871 0.3 0.1179 0.1217 0.125 0.4 0.1554 0.1591 0.1628 0.5 0.1915 0 1950 1985 0. 4 02257 0.2291 02324 0.7 0255002611 0.2642 0.03 0.04 0.012000160 0.0517 0.0557 0.0910 0.0948 0.1293 0.1331 0.1664 0.1700 0.2019 0.2054 0.2357 0.2389 0.2673 0.2704 0.05 0.0199 0.0596 0.0987 0.1368 0.1736 0.2088 0.2422 0.2734 0.06 0.0239 0.0636 0.1026 0.1406 0.1772 0.2123 0.2454 0.2764 0.07 0.0279 0.0675 0.1064 0.1443 0.1808 0.2157 0.2486 0.2794 0.08 0.0319 0.0714 0.1103 0.1480 0.1844 0.2190 0.2517 0.2823 0.09 0.0359 0.0753 0.1141 0.1517 0.1879 02224 025.49 0.2852 20 0.18 0.490 .41 1.59 0.59 0.0 z 0.00 0.01 0.02 0.0040 0.0080 0.11 0.0398 0.0438 0.0478 0.2 0.0793 0.0832 0.0871 0.3 0.1179 0.1217 0.1235 0.4 0.1554 0.1591 0.1628 0.5 0.1915 0.1950 0.1985 0.6 0.2257 0.2291 0.2324 0.7 0.2580 0.2611 0.2642 0.8 0.2881 0.2910 0.2939 0.9 0.3159 0.2186 0.3212 1.0 0.3413 0 438 0.3461 1.1 0.3643 0.3665 0.3686 1.2 0.3849 0.3869 0.3888 1.3 0.4032 0.4049 0.4066 1.4 0.4192 0.4207 0.4222 1.5 0.4332 0.4345 0.4357 1.6 0.4452 0.4463 0.4474 1.7 0.4554 0.4564 0.4573 1.8 0.4641 0.4649 04656 1.9 0.4713 0.4719 4726 2.0 0.4772 0.4778 4783 2.1 0.4821 0.4826 4830 2.2 0.4861 0.4864 0.4868 23 0.4893 0.4896 0.4898 2.4 0.4918 0.4920 0.4922 2.5 0.4938 0.4940 0.4941 2.6 0.4953 0.4955 0.4956 2.7 0.4965 0.4966 0.4967 2.8 0.4974 0.4975 0.4976 2.9 0.4981 0.4982 0.4982 3.01 0.4987 0.4987 0.4987 0.03 0.0120 0.0517 0.0910 0.1293 0.166 0.2017 0.2357 0.2673 0.2967 0.3238 0.3485 0.3708 0.3907 0.4082 0.4236 0.4370 0.4484 0.4582 0.4664 0.4732 0.4788 0.4834 0.4871 0.4901 0.4925 0.4943 0.4957 0.4968 0.4977 0.4983 0.4988 0.04 0.0160 0.0557 0.0948 0.1331 0.1700 0.2054 0.2389 0.2704 0.2995 0.3264 0.3508 0.3729 0.3925 0.4099 0.4251 0.4382 0.4495 0.4591 0.4671 0.4738 0.4793 0.4838 0.4875 0.4904 0.4927 0.4945 0.4959 0.4969 0.4977 0.4984 0.4988 0.05 0.0199 0.0596 0.0987 0.1368 0.1736 0.2088 0.2422 0.2734 0.3023 0.3289 0.3531 0.3749 0.3944 0.4115 0.4265 0.4394 0.4505 0.4599 0.4678 0.4744 0.4798 0.4842 0.4878 0.4906 0.4929 0.4946 0.4960 0.4970 0.4978 0.4984 0.4989 0.06 0.07 0.08 0.09 0.0239 0.0279 0.0319 0.0359 0.0636 0.0675 0.0714 0.0753 0.1026 0.1064 0.1103 0.1141 0.1406 0.1443 0.1480 0.1517 0.1772 0.1808 0.1844 0.1879 0.2123 0.2157 0.2190 02224 0.2454 0.2486 0.2517 549 0.2764 0.2794 0.2823 0.2852 0.3051 0.3078 0.3106 0.3133 0.3315 0.3340 0.3365 0.3389 0.3554 0.3577 3599 0.3621 0.3770 0.3790 0.3810 0.3830 0.3962 0.3980 0.3997 0.4015 0.4131 0.4147 0.4162 0.4177 0.4279 0.4292 0.4306 0.4319 0.4406 0.4418 0.4429 0.4441 0.4515 0.4525 4 4 455 0.4608 0.4616 C 0.4686 0.4693 C 0.4750 0.4756 0.4 0...67 0.4803 0.4808 0.4812 0 4817 0.4846 0.4850 0.4854 04857 0.4881 0.4884 0.4887 4890 0.4909 0.4911 0.4913 0.4916 0.4931 0.4932 0.4934 0.4936 0.4948 0.4949 0.4951 0.4952 0.4961 0.4962 0.4963 0.4964 0.4971 0.4972 0.4973 0.4974 0.4979 0.4979 0.4980 0.4981 0.4985 0.4985 0.4986 0.4936 0.4989 0.4989 0.4990 0.4990 1 Question 1 (5 points) Saved A process has a mean of 7.3 and standard deviation of 0.10. The customer lower specification of 7.0 and an upper specification of 8.0. Calculate the capability ratio. Question 1 (5 points) Saved A process has a mean of 7.3 and standard deviation of 0.10. The customer has a lower specification of 7.0 and an upper specification of 8.0. Calculate the process capability ratio. Round your answer to three decimal points. Your Answer: Answer Question 2 (2.5 points) Saved A quality inspector ook five samples, each with 5 observations, of ength of time for glue to dry. The analyst computed the mean of each sample, and then computed the grand mean of 2.17. Use this information to obtain the three-sigma upper control limit for the means of future times. It is known from previous experience that the standard deviation of the process is 0.05. Your Answer: 12.24 Answer A quality inspector took six samples, each with twenty observations of the weight of

Step by Step Solution

There are 3 Steps involved in it

1 Expert Approved Answer
Step: 1 Unlock blur-text-image
Question Has Been Solved by an Expert!

Get step-by-step solutions from verified subject matter experts

Step: 2 Unlock
Step: 3 Unlock

Students Have Also Explored These Related General Management Questions!