

Question: Construct the frequency polygon, histogram, dot plot, stem and leaf, bar chart, pie chart, time series chart using Excel or Minitab. Then follow other instructed
Construct the frequency polygon, histogram, dot plot, stem and leaf, bar chart, pie chart, time series chart using Excel or Minitab. Then follow other instructed below. Thank you and Godbless
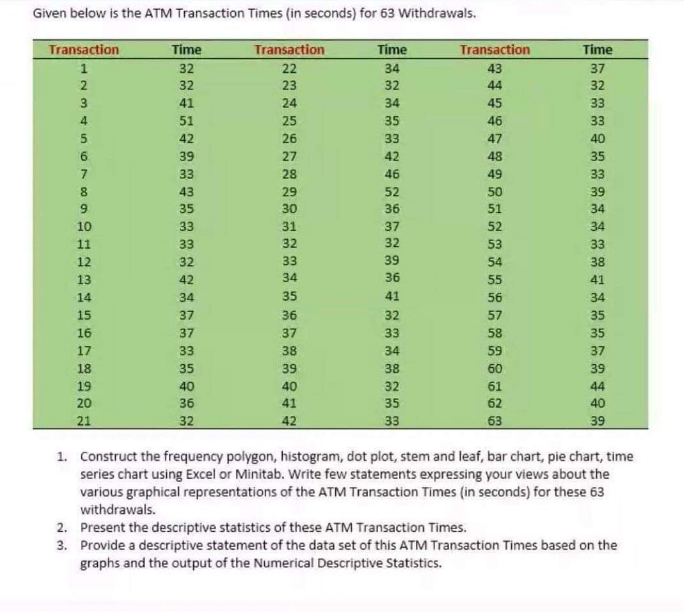
Given below is the ATM Transaction Times (in seconds) for 63 Withdrawals. Transaction Time Transaction Time Transaction Time 32 22 34 43 37 32 23 32 44 32 41 24 34 45 33 51 25 35 46 33 42 26 33 47 40 39 27 42 48 35 33 28 46 49 33 29 52 50 39 35 30 36 51 34 33 31 37 52 34 33 32 32 53 33 32 33 39 54 38 42 34 36 55 41 34 35 41 56 34 15 37 36 32 57 35 16 37 37 33 58 35 17 33 38 34 59 37 18 35 39 38 60 39 19 40 40 32 61 44 20 36 41 35 62 40 21 32 42 33 63 39 1. Construct the frequency polygon, histogram, dot plot, stem and leaf, bar chart, pie chart, time series chart using Excel or Minitab. Write few statements expressing your views about the various graphical representations of the ATM Transaction Times (in seconds) for these 63 withdrawals. 2. Present the descriptive statistics of these ATM Transaction Times. 3. Provide a descriptive statement of the data set of this ATM Transaction Times based on the graphs and the output of the Numerical Descriptive Statistics
Step by Step Solution
There are 3 Steps involved in it

Get step-by-step solutions from verified subject matter experts