

Question: construct the graph using the table result time vs ph. see C) to construct the graph TABLE 4.7 Time of Starch Disappearance in Different pH
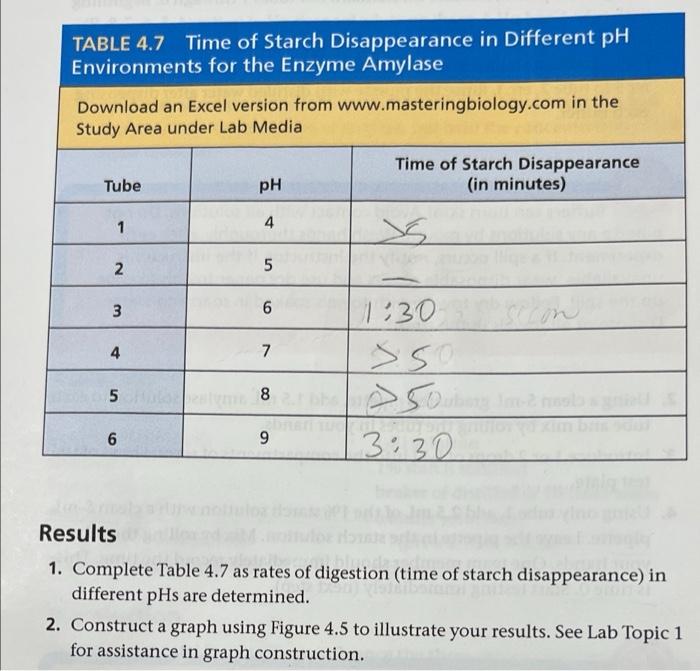
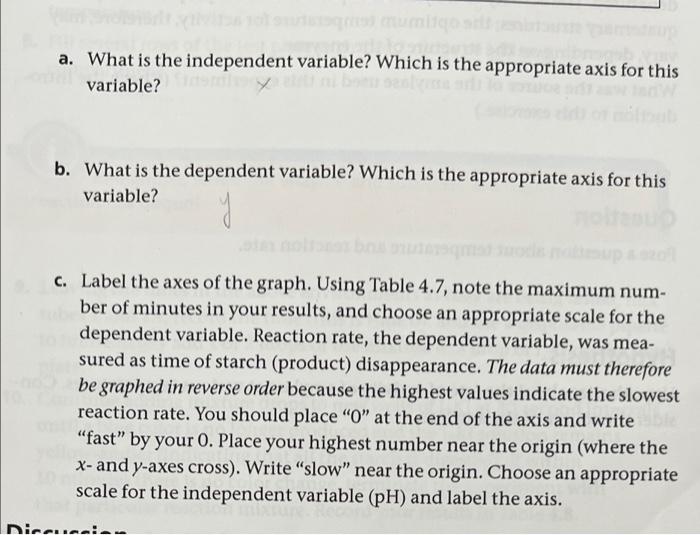
TABLE 4.7 Time of Starch Disappearance in Different pH Environments for the Enzyme Amylase Download an Excel version from www.masteringbiology.com in the Study Area under Lab Media Time of Starch Disappearance (in minutes) Tube pH 1 4 2 5 3 6 Scoon 1:30 >50 4 7 5 8 6 9 3:30 Results 1. Complete Table 4.7 as rates of digestion (time of starch disappearance) in different pHs are determined. 2. Construct a graph using Figure 4.5 to illustrate your results. See Lab Topic 1 for assistance in graph construction. a. What is the independent variable? Which is the appropriate axis for this variable? b. What is the dependent variable? Which is the appropriate axis for this variable? y C. Label the axes of the graph. Using Table 4.7, note the maximum num- ber of minutes in your results, and choose an appropriate scale for the dependent variable. Reaction rate, the dependent variable, was mea- sured as time of starch (product) disappearance. The data must therefore be graphed in reverse order because the highest values indicate the slowest reaction rate. You should place "O" at the end of the axis and write "fast" by your 0. Place your highest number near the origin (where the x-and y-axes cross). Write "slow" near the origin. Choose an appropriate scale for the independent variable (pH) and label the axis. Diccu
Step by Step Solution
There are 3 Steps involved in it

Get step-by-step solutions from verified subject matter experts