

Question: Construct the R and X-bar control charts for the process along with their control limits, and assess whether the process is stable (under statistical control)
Construct the R and X-bar control charts for the process along with their control limits, and assess whether the process is stable (under statistical control) or not. If the process is not stable, re-construct the control chart until you find the process to be stable.
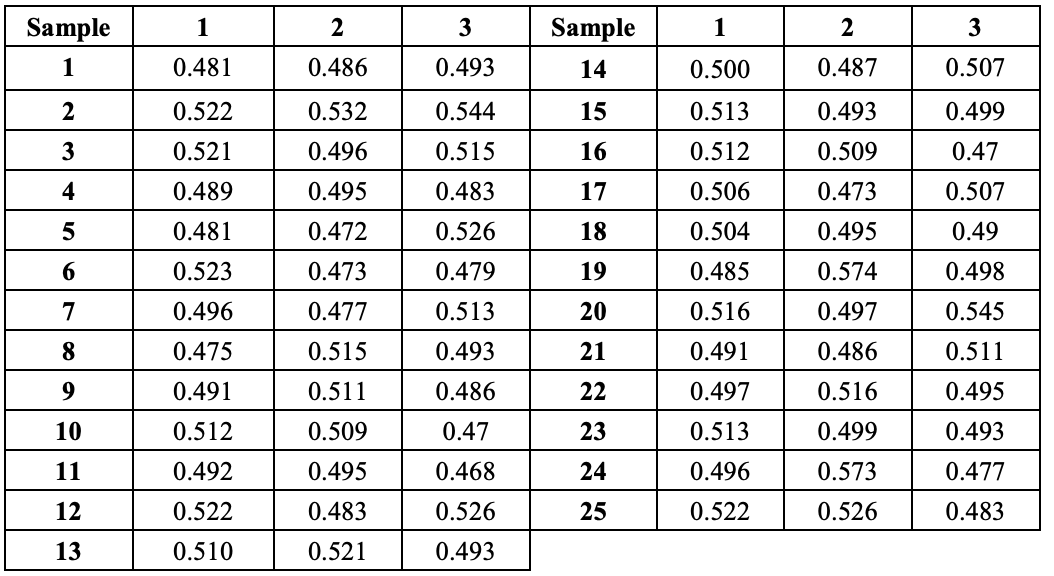
For this Question, keep all measurements at 3 decimal points in your calculations.
Sample 1 2 3 1 2 3 Sample 14 1 0.481 0.486 0.493 0.500 0.487 0.507 2 0.522 0.532 0.544 15 0.513 0.493 0.499 3 0.521 0.496 0.515 16 0.512 0.509 0.47 4 0.489 0.495 0.483 17 0.506 0.473 0.507 5 0.481 0.472 0.526 18 0.504 0.495 0.49 6 0.523 0.473 0.479 19 0.485 0.574 0.498 7 0.496 0.477 0.513 20 0.516 0.497 0.545 8 0.475 0.515 0.493 21 0.491 0.486 0.511 9 0.491 0.511 0.486 22 0.497 0.516 0.495 10 0.512 0.509 0.47 23 0.513 0.499 0.493 11 0.492 0.495 0.468 24 0.496 0.573 0.477 12 0.522 0.483 0.526 25 0.522 0.526 0.483 13 0.510 0.521 0.493Step by Step Solution
There are 3 Steps involved in it
1 Expert Approved Answer
Step: 1 Unlock

Question Has Been Solved by an Expert!
Get step-by-step solutions from verified subject matter experts
Step: 2 Unlock
Step: 3 Unlock