

Question: Instructions The data in the Engine Piston Rings Excel file presents the inside diameter measurements of forged automobile engine piston rings in mm. Each sample
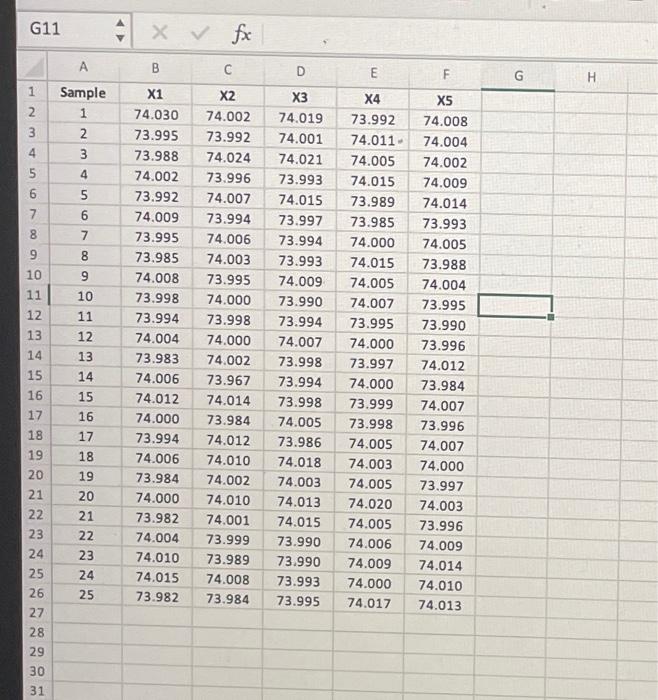
Instructions The data in the "Engine Piston Rings" Excel file presents the inside diameter measurements of forged automobile engine piston rings in mm. Each sample or subgroup consists of five piston rings taken every 15 minutes from a process. Assume that the upper and lower specification limits on the inside diameter of the engine ring pistons are 74.0000.05 millimeter. a. Use this data to construct and plot X-bar and R control charts. Is the process under control? why? Calculate process capability index. b. Use this data to construct and plot X-bar and S control charts. Calculate process capability index. c. Are the two estimated indices in parts a and b are different? Why? d. Explain under what condition you are allowed to calculate process capability index. \begin{tabular}{|c|c|c|c|c|c|c|c|c|} \hline \multicolumn{2}{|c|}{ G11 } & x & fx & \multicolumn{2}{|l|}{ c } & \multirow[b]{2}{*}{ F } & \multirow[b]{2}{*}{ G } & \multirow[b]{2}{*}{ H } \\ \hline 4 & A & B & C & D & E & & & \\ \hline 1 & Sample & x1 & x2 & x3 & X4 & X5 & & \\ \hline 2 & 1 & 74.030 & 74.002 & 74.019 & 73.992 & 74.008 & & \\ \hline 3 & 2 & 73.995 & 73.992 & 74.001 & 74.011 & 74.004 & & \\ \hline 4 & 3 & 73.988 & 74.024 & 74.021 & 74.005 & 74.002 & & \\ \hline 5 & 4 & 74.002 & 73.996 & 73.993 & 74.015 & 74.009 & & \\ \hline 6 & 5 & 73.992 & 74.007 & 74.015 & 73.989 & 74.014 & & \\ \hline 7 & 6 & 74.009 & 73.994 & 73.997 & 73.985 & 73.993 & & \\ \hline 8 & 7 & 73.995 & 74.006 & 73.994 & 74.000 & 74.005 & & \\ \hline 9 & 8 & 73.985 & 74.003 & 73.993 & 74.015 & 73.988 & & \\ \hline 10 & 9 & 74.008 & 73.995 & 74.009 & 74.005 & 74.004 & & \\ \hline 11 & 10 & 73.998 & 74.000 & 73.990 & 74.007 & 73.995 & & \\ \hline 12 & 11 & 73.994 & 73.998 & 73.994 & 73.995 & 73.990 & & \\ \hline 13 & 12 & 74.004 & 74.000 & 74.007 & 74.000 & 73.996 & & \\ \hline 14 & 13 & 73.983 & 74.002 & 73.998 & 73.997 & 74.012 & & \\ \hline 15 & 14 & 74.006 & 73.967 & 73.994 & 74.000 & 73.984 & & \\ \hline 16 & 15 & 74.012 & 74.014 & 73.998 & 73.999 & 74.007 & & \\ \hline 17 & 16 & 74.000 & 73.984 & 74.005 & 73.998 & 73.996 & & \\ \hline 18 & 17 & 73.994 & 74.012 & 73.986 & 74.005 & 74.007 & & \\ \hline 19 & 18 & 74.006 & 74.010 & 74.018 & 74.003 & 74.000 & & \\ \hline 20 & 19 & 73.984 & 74.002 & 74.003 & 74.005 & 73.997 & & \\ \hline 21 & 20 & 74.000 & 74.010 & 74.013 & 74.020 & 74.003 & & \\ \hline 22 & 21 & 73.982 & 74.001 & 74.015 & 74.005 & 73.996 & & \\ \hline 23 & 22 & 74.004 & 73.999 & 73.990 & 74.006 & 74.009 & & \\ \hline 24 & 23 & 74.010 & 73.989 & 73.990 & 74.009 & 74.014 & & \\ \hline 25 & 24 & 74.015 & 74.008 & 73.993 & 74.000 & 74.010 & & \\ \hline 26 & 25 & 73.982 & 73.984 & 73.995 & 74.017 & 74.013 & & \\ \hline 27 & & & & & & & & \\ \hline 28 & & & & & & & & \\ \hline 29 & & & 2 & & & & & \\ \hline \begin{tabular}{l} 30 \\ 31 \end{tabular} & & & & & & & & \\ \hline \end{tabular} Instructions The data in the "Engine Piston Rings" Excel file presents the inside diameter measurements of forged automobile engine piston rings in mm. Each sample or subgroup consists of five piston rings taken every 15 minutes from a process. Assume that the upper and lower specification limits on the inside diameter of the engine ring pistons are 74.0000.05 millimeter. a. Use this data to construct and plot X-bar and R control charts. Is the process under control? why? Calculate process capability index. b. Use this data to construct and plot X-bar and S control charts. Calculate process capability index. c. Are the two estimated indices in parts a and b are different? Why? d. Explain under what condition you are allowed to calculate process capability index. \begin{tabular}{|c|c|c|c|c|c|c|c|c|} \hline \multicolumn{2}{|c|}{ G11 } & x & fx & \multicolumn{2}{|l|}{ c } & \multirow[b]{2}{*}{ F } & \multirow[b]{2}{*}{ G } & \multirow[b]{2}{*}{ H } \\ \hline 4 & A & B & C & D & E & & & \\ \hline 1 & Sample & x1 & x2 & x3 & X4 & X5 & & \\ \hline 2 & 1 & 74.030 & 74.002 & 74.019 & 73.992 & 74.008 & & \\ \hline 3 & 2 & 73.995 & 73.992 & 74.001 & 74.011 & 74.004 & & \\ \hline 4 & 3 & 73.988 & 74.024 & 74.021 & 74.005 & 74.002 & & \\ \hline 5 & 4 & 74.002 & 73.996 & 73.993 & 74.015 & 74.009 & & \\ \hline 6 & 5 & 73.992 & 74.007 & 74.015 & 73.989 & 74.014 & & \\ \hline 7 & 6 & 74.009 & 73.994 & 73.997 & 73.985 & 73.993 & & \\ \hline 8 & 7 & 73.995 & 74.006 & 73.994 & 74.000 & 74.005 & & \\ \hline 9 & 8 & 73.985 & 74.003 & 73.993 & 74.015 & 73.988 & & \\ \hline 10 & 9 & 74.008 & 73.995 & 74.009 & 74.005 & 74.004 & & \\ \hline 11 & 10 & 73.998 & 74.000 & 73.990 & 74.007 & 73.995 & & \\ \hline 12 & 11 & 73.994 & 73.998 & 73.994 & 73.995 & 73.990 & & \\ \hline 13 & 12 & 74.004 & 74.000 & 74.007 & 74.000 & 73.996 & & \\ \hline 14 & 13 & 73.983 & 74.002 & 73.998 & 73.997 & 74.012 & & \\ \hline 15 & 14 & 74.006 & 73.967 & 73.994 & 74.000 & 73.984 & & \\ \hline 16 & 15 & 74.012 & 74.014 & 73.998 & 73.999 & 74.007 & & \\ \hline 17 & 16 & 74.000 & 73.984 & 74.005 & 73.998 & 73.996 & & \\ \hline 18 & 17 & 73.994 & 74.012 & 73.986 & 74.005 & 74.007 & & \\ \hline 19 & 18 & 74.006 & 74.010 & 74.018 & 74.003 & 74.000 & & \\ \hline 20 & 19 & 73.984 & 74.002 & 74.003 & 74.005 & 73.997 & & \\ \hline 21 & 20 & 74.000 & 74.010 & 74.013 & 74.020 & 74.003 & & \\ \hline 22 & 21 & 73.982 & 74.001 & 74.015 & 74.005 & 73.996 & & \\ \hline 23 & 22 & 74.004 & 73.999 & 73.990 & 74.006 & 74.009 & & \\ \hline 24 & 23 & 74.010 & 73.989 & 73.990 & 74.009 & 74.014 & & \\ \hline 25 & 24 & 74.015 & 74.008 & 73.993 & 74.000 & 74.010 & & \\ \hline 26 & 25 & 73.982 & 73.984 & 73.995 & 74.017 & 74.013 & & \\ \hline 27 & & & & & & & & \\ \hline 28 & & & & & & & & \\ \hline 29 & & & 2 & & & & & \\ \hline \begin{tabular}{l} 30 \\ 31 \end{tabular} & & & & & & & & \\ \hline \end{tabular}
Step by Step Solution
There are 3 Steps involved in it

Get step-by-step solutions from verified subject matter experts