Question: MGMT 4630 SPC Assignment #1 Read the scenario below. Then construct and interpret the appropriate control charts. Exercise Objective: Construct and interpret statistical process control
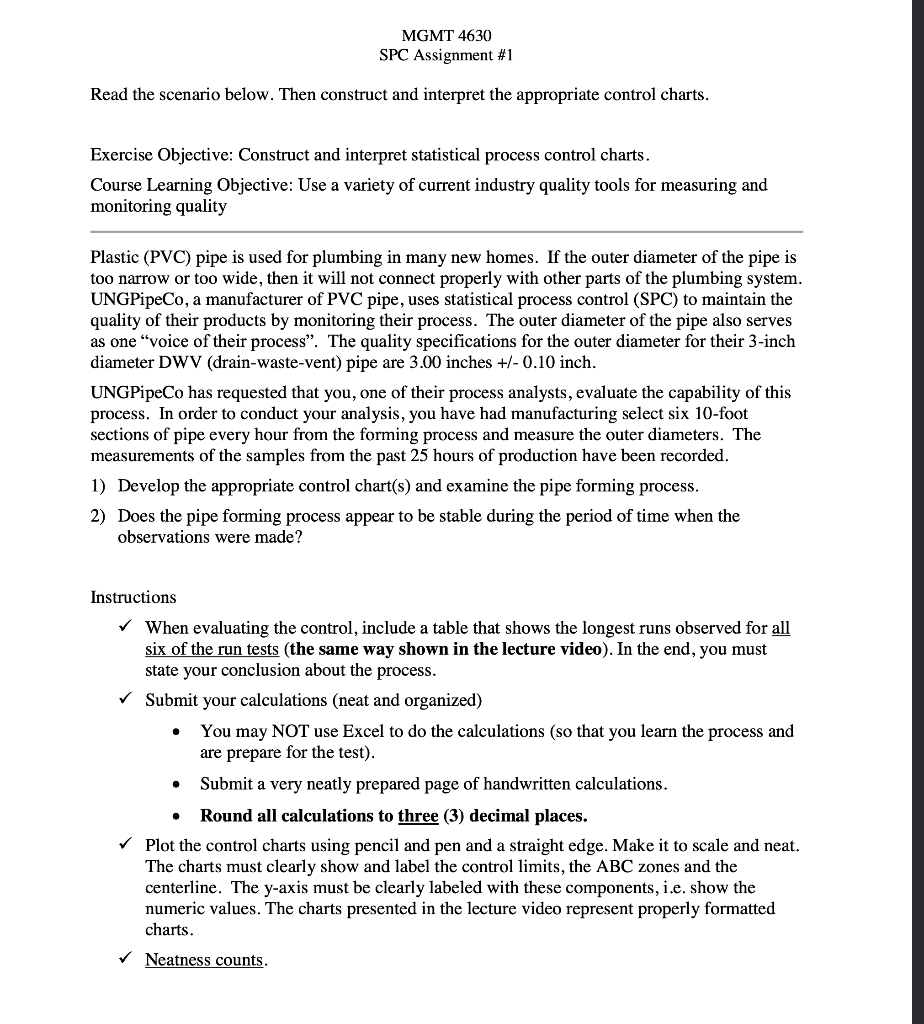
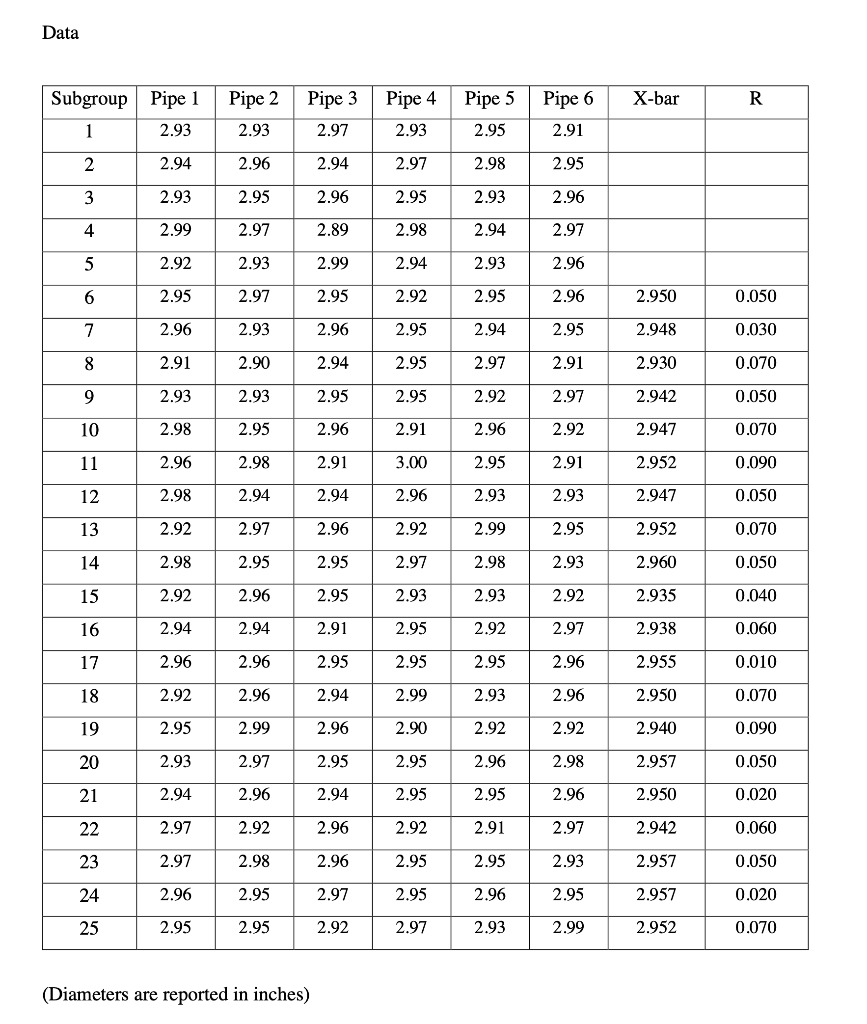
MGMT 4630 SPC Assignment #1 Read the scenario below. Then construct and interpret the appropriate control charts. Exercise Objective: Construct and interpret statistical process control charts. Course Learning Objective: Use a variety of current industry quality tools for measuring and monitoring quality Plastic (PVC) pipe is used for plumbing in many new homes. If the outer diameter of the pipe is too narrow or too wide, then it will not connect properly with other parts of the plumbing system. UNGPipeCo, a manufacturer of PVC pipe, uses statistical process control (SPC) to maintain the quality of their products by monitoring their process. The outer diameter of the pipe also serves as one "voice of their process. The quality specifications for the outer diameter for their 3-inch diameter DWV (drain-waste-vent) pipe are 3.00 inches +/- 0.10 inch. UNGPipeCo has requested that you, one of their process analysts, evaluate the capability of this process. In order to conduct your analysis, you have had manufacturing select six 10-foot sections of pipe every hour from the forming process and measure the outer diameters. The measurements of the samples from the past 25 hours of production have been recorded. 1) Develop the appropriate control chart(s) and examine the pipe forming process. 2) Does the pipe forming process appear to be stable during the period of time when the observations were made? Instructions When evaluating the control, include a table that shows the longest runs observed for all six of the run tests (the same way shown in the lecture video). In the end, you must state your conclusion about the process. Submit your calculations (neat and organized) You may NOT use Excel to do the calculations (so that you learn the process and are prepare for the test). Submit a very neatly prepared page of handwritten calculations. Round all calculations to three (3) decimal places. Plot the control charts using pencil and pen and a straight edge. Make it to scale and neat. The charts must clearly show and label the control limits, the ABC zones and the centerline. The y-axis must be clearly labeled with these components, i.e. show the numeric values. The charts presented in the lecture video represent properly formatted charts. Neatness counts. Data Subgroup Pipe 1 Pipe 2 Pipe 3 Pipe 4 Pipe 5 Pipe 6 X-bar R 1 2.93 2.93 2.97 2.93 2.95 2.91 2 2.94 2.96 2.94 2.97 2.98 2.95 3 2.93 2.95 2.96 2.95 2.93 2.96 4 2.99 2.97 2.89 2.98 2.94 2.97 5 2.92 2.93 2.99 2.94 2.93 2.96 6 2.95 2.97 2.95 2.92 2.95 2.96 2.950 0.050 7 2.96 2.93 2.96 2.95 2.94 2.95 2.948 0.030 8 2.91 2.90 2.94 2.95 2.97 2.91 2.930 0.070 9 2.93 2.93 2.95 2.95 2.92 2.97 2.942 0.050 10 2.98 2.95 2.96 2.91 2.96 2.92 2.947 0.070 11 2.96 2.98 2.91 3.00 2.95 2.91 2.952 0.090 12 2.98 2.94 2.94 2.96 2.93 2.93 2.947 0.050 13 2.92 2.97 2.96 2.92 2.99 2.95 2.952 0.070 14 2.98 2.95 2.95 2.97 2.98 2.93 2.960 0.050 15 2.92 2.96 2.95 2.93 2.93 2.92 2.935 0.040 16 2.94 2.94 2.91 2.95 2.92 2.97 2.938 0.060 17 2.96 2.96 2.95 2.95 2.95 2.96 2.955 0.010 18 2.92 2.96 2.94 2.99 2.93 2.96 2.950 0.070 19 2.95 2.99 2.96 2.90 2.92 2.92 2.940 0.090 20 2.93 2.97 2.95 2.95 2.96 2.98 2.957 0.050 21 2.94 2.96 2.94 2.95 2.95 2.96 2.950 0.020 22 2.97 2.92 2.96 2.92 2.91 2.97 2.942 0.060 23 2.97 2.98 2.96 2.95 2.95 2.93 2.957 0.050 24 2.96 2.95 2.97 2.95 2.96 2.95 2.957 0.020 25 2.95 2.95 2.92 2.97 2.93 2.99 2.952 0.070 (Diameters are reported in inches) MGMT 4630 SPC Assignment #1 Read the scenario below. Then construct and interpret the appropriate control charts. Exercise Objective: Construct and interpret statistical process control charts. Course Learning Objective: Use a variety of current industry quality tools for measuring and monitoring quality Plastic (PVC) pipe is used for plumbing in many new homes. If the outer diameter of the pipe is too narrow or too wide, then it will not connect properly with other parts of the plumbing system. UNGPipeCo, a manufacturer of PVC pipe, uses statistical process control (SPC) to maintain the quality of their products by monitoring their process. The outer diameter of the pipe also serves as one "voice of their process. The quality specifications for the outer diameter for their 3-inch diameter DWV (drain-waste-vent) pipe are 3.00 inches +/- 0.10 inch. UNGPipeCo has requested that you, one of their process analysts, evaluate the capability of this process. In order to conduct your analysis, you have had manufacturing select six 10-foot sections of pipe every hour from the forming process and measure the outer diameters. The measurements of the samples from the past 25 hours of production have been recorded. 1) Develop the appropriate control chart(s) and examine the pipe forming process. 2) Does the pipe forming process appear to be stable during the period of time when the observations were made? Instructions When evaluating the control, include a table that shows the longest runs observed for all six of the run tests (the same way shown in the lecture video). In the end, you must state your conclusion about the process. Submit your calculations (neat and organized) You may NOT use Excel to do the calculations (so that you learn the process and are prepare for the test). Submit a very neatly prepared page of handwritten calculations. Round all calculations to three (3) decimal places. Plot the control charts using pencil and pen and a straight edge. Make it to scale and neat. The charts must clearly show and label the control limits, the ABC zones and the centerline. The y-axis must be clearly labeled with these components, i.e. show the numeric values. The charts presented in the lecture video represent properly formatted charts. Neatness counts. Data Subgroup Pipe 1 Pipe 2 Pipe 3 Pipe 4 Pipe 5 Pipe 6 X-bar R 1 2.93 2.93 2.97 2.93 2.95 2.91 2 2.94 2.96 2.94 2.97 2.98 2.95 3 2.93 2.95 2.96 2.95 2.93 2.96 4 2.99 2.97 2.89 2.98 2.94 2.97 5 2.92 2.93 2.99 2.94 2.93 2.96 6 2.95 2.97 2.95 2.92 2.95 2.96 2.950 0.050 7 2.96 2.93 2.96 2.95 2.94 2.95 2.948 0.030 8 2.91 2.90 2.94 2.95 2.97 2.91 2.930 0.070 9 2.93 2.93 2.95 2.95 2.92 2.97 2.942 0.050 10 2.98 2.95 2.96 2.91 2.96 2.92 2.947 0.070 11 2.96 2.98 2.91 3.00 2.95 2.91 2.952 0.090 12 2.98 2.94 2.94 2.96 2.93 2.93 2.947 0.050 13 2.92 2.97 2.96 2.92 2.99 2.95 2.952 0.070 14 2.98 2.95 2.95 2.97 2.98 2.93 2.960 0.050 15 2.92 2.96 2.95 2.93 2.93 2.92 2.935 0.040 16 2.94 2.94 2.91 2.95 2.92 2.97 2.938 0.060 17 2.96 2.96 2.95 2.95 2.95 2.96 2.955 0.010 18 2.92 2.96 2.94 2.99 2.93 2.96 2.950 0.070 19 2.95 2.99 2.96 2.90 2.92 2.92 2.940 0.090 20 2.93 2.97 2.95 2.95 2.96 2.98 2.957 0.050 21 2.94 2.96 2.94 2.95 2.95 2.96 2.950 0.020 22 2.97 2.92 2.96 2.92 2.91 2.97 2.942 0.060 23 2.97 2.98 2.96 2.95 2.95 2.93 2.957 0.050 24 2.96 2.95 2.97 2.95 2.96 2.95 2.957 0.020 25 2.95 2.95 2.92 2.97 2.93 2.99 2.952 0.070 (Diameters are reported in inches)


