

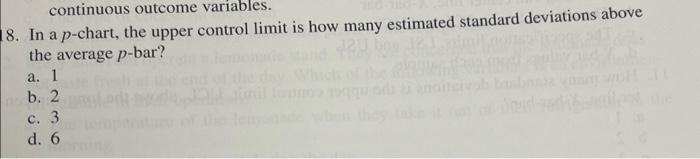
Question: continuous outcome variables. 18. In a p-chart, the upper control limit is how many estimated standard deviations above the average p-bar? a. 1 b. 2
Step by Step Solution
There are 3 Steps involved in it
1 Expert Approved Answer
Step: 1 Unlock

Question Has Been Solved by an Expert!
Get step-by-step solutions from verified subject matter experts
Step: 2 Unlock
Step: 3 Unlock