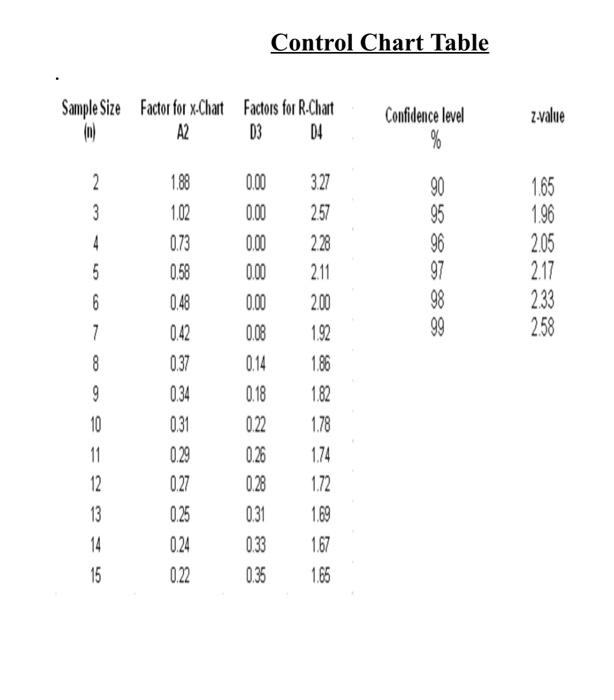
Question: Control Chart Table Sample Size Factor for X-Chart Factors for R.Chart A2 03 D4 z-value Confidence level % 2 N 3 4 5 95 96

Control Chart Table Sample Size Factor for
Control Chart Table Sample Size Factor for X-Chart Factors for R.Chart A2 03 D4 z-value Confidence level % 2 N 3 4 5 95 96 97 1.65 1.96 2.05 2.17 233 2.58 6 7 8 1.88 1.02 0.73 0.58 0.48 0.42 0.37 0.34 0.31 0.29 0.27 0.25 0.24 0.22 0.00 0.00 0.00 0.00 0.00 0.08 014 0.18 0.22 0.26 0.28 0.31 0.33 0.35 3.27 2.57 228 211 2.00 1.92 1.86 182 1.78 1.74 1.72 1.69 167 1.65 9 10 11 12 13 14 15 A manager wishes to build a control chart for a process. A total of five (05) samples are collected with four (04) observations within each sample. The sample means (X-bar) are; 14.09, 13.94, 16.86, 18.77, and 16.64 respectively. Also, the corresponding ranges are: 10.5, 7.73, 5.89, 7.56, and 3.49 respectively. The lower and upper control limits of the R-chart are respectively Select one: O a. None is correct b. 1, 10.5 O c.0, 13.32 O d. 0,14.40 O e. 0, 16.04

Step by Step Solution

There are 3 Steps involved in it

1 Expert Approved Answer
Step: 1 Unlock blur-text-image
Question Has Been Solved by an Expert!

Get step-by-step solutions from verified subject matter experts

Step: 2 Unlock
Step: 3 Unlock

Students Have Also Explored These Related General Management Questions!