

Question: Control charts for a process have previously been constructed. The X-Bar Chart upper and lower control limits are 92.5 and 88.5 , respectively. New samples
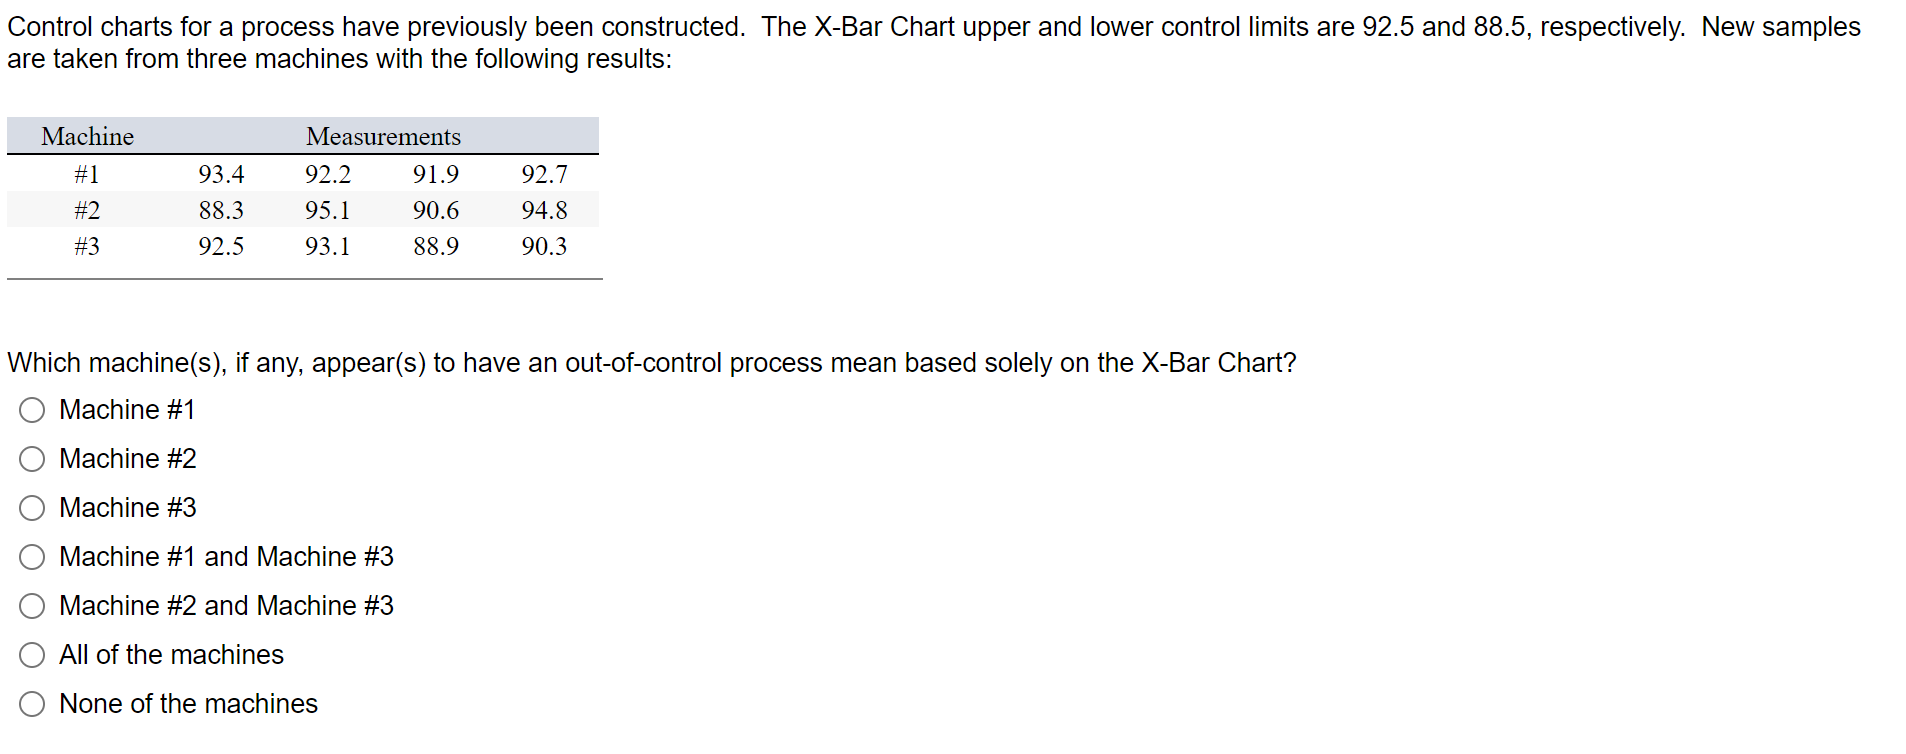
Control charts for a process have previously been constructed. The X-Bar Chart upper and lower control limits are 92.5 and 88.5 , respectively. New samples are taken from three machines with the following results: Which machine(s), if any, appear(s) to have an out-of-control process mean based solely on the X-Bar Chart? Machine \#1 Machine \#2 Machine \#3 Machine \#1 and Machine \#3 Machine \#2 and Machine \#3 All of the machines None of the machines
Step by Step Solution
There are 3 Steps involved in it
1 Expert Approved Answer
Step: 1 Unlock

Question Has Been Solved by an Expert!
Get step-by-step solutions from verified subject matter experts
Step: 2 Unlock
Step: 3 Unlock