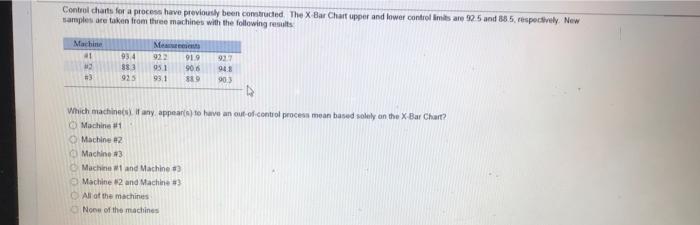
Question: Control charts for a process have previously been constructed. The X-Bar Chart upper and lower control Imits are 92.5 and 88.5, respectively. New samples are

Control charts for a process have previously been
Control charts for a process have previously been constructed. The X-Bar Chart upper and lower control Imits are 92.5 and 88.5, respectively. New samples are taken from three machines with the following results Machine 41 #2 #3 Measrements 92.2 91.9 92.7 93.4 88.3 95.1 90.6 94.8 925 93.1 88.9 90.3 Which machine(s) If any appear(s) to have an out-of-control process mean based solely on the X-Bar Chart? Machine #1 Machine #2 Machine #3 Machine #1 and Machine #3 Machine #2 and Machine #3 All of the machines None of the machines

Step by Step Solution

There are 3 Steps involved in it

1 Expert Approved Answer
Step: 1 Unlock blur-text-image
Question Has Been Solved by an Expert!

Get step-by-step solutions from verified subject matter experts

Step: 2 Unlock
Step: 3 Unlock

Students Have Also Explored These Related General Management Questions!