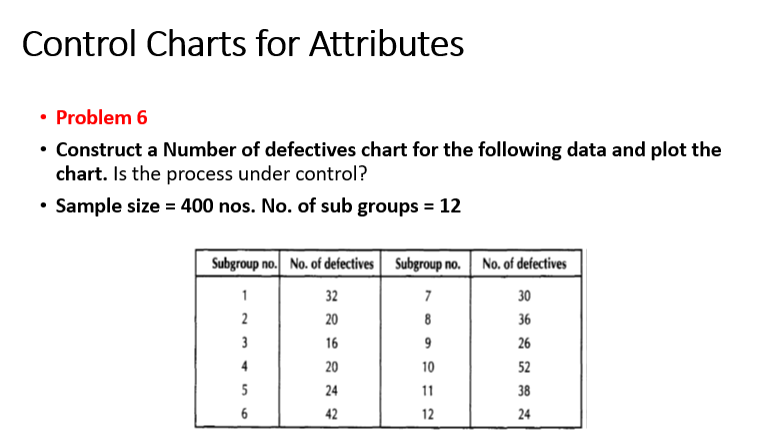
Question: Control Charts for Attributes Problem 6 Construct a Number of defectives chart for the following data and plot the chart. Is the process under control?

Control Charts for Attributes Problem 6 Construct

Control Charts for Attributes Problem 6 Construct a Number of defectives chart for the following data and plot the chart. Is the process under control? Sample size = 400 nos. No. of sub groups = 12 Subgroup no. No. of defectives Subgroup no. No. of defectives 1 32 7 30 2 20 8 36 3 16 9 26 4 20 10 52 5 24 11 38 6 42 12 24

Step by Step Solution

There are 3 Steps involved in it

1 Expert Approved Answer
Step: 1 Unlock blur-text-image
Question Has Been Solved by an Expert!

Get step-by-step solutions from verified subject matter experts

Step: 2 Unlock
Step: 3 Unlock

Students Have Also Explored These Related General Management Questions!