

Question: Control Limits Describe how Control Limits would be set for the following Control Chart and determine what the cause in the variation: Data included: According
Control Limits
Describe how Control Limits would be set for the following Control Chart and determine what the cause in the variation:
Data included:
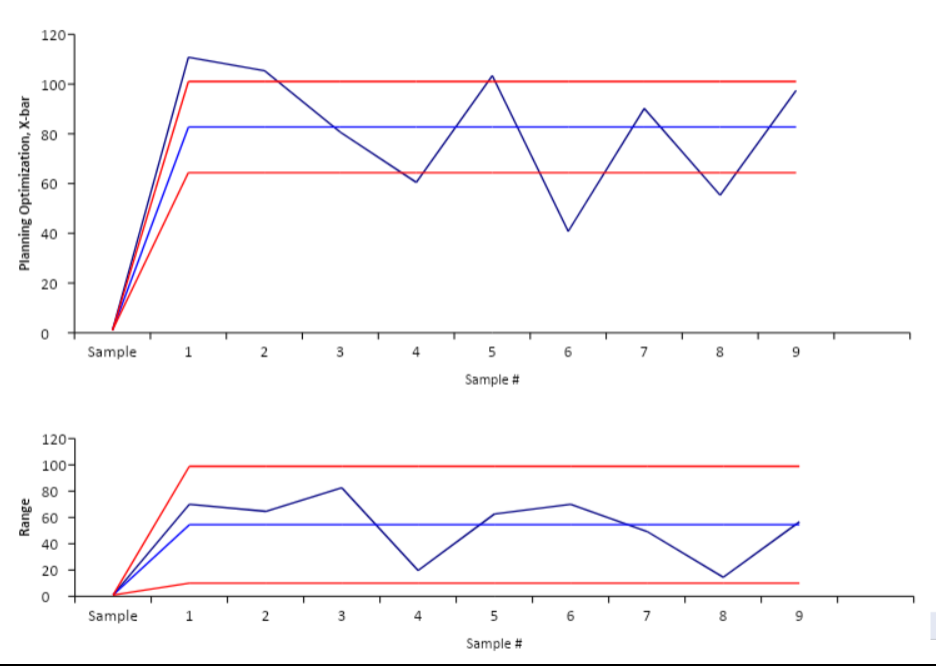
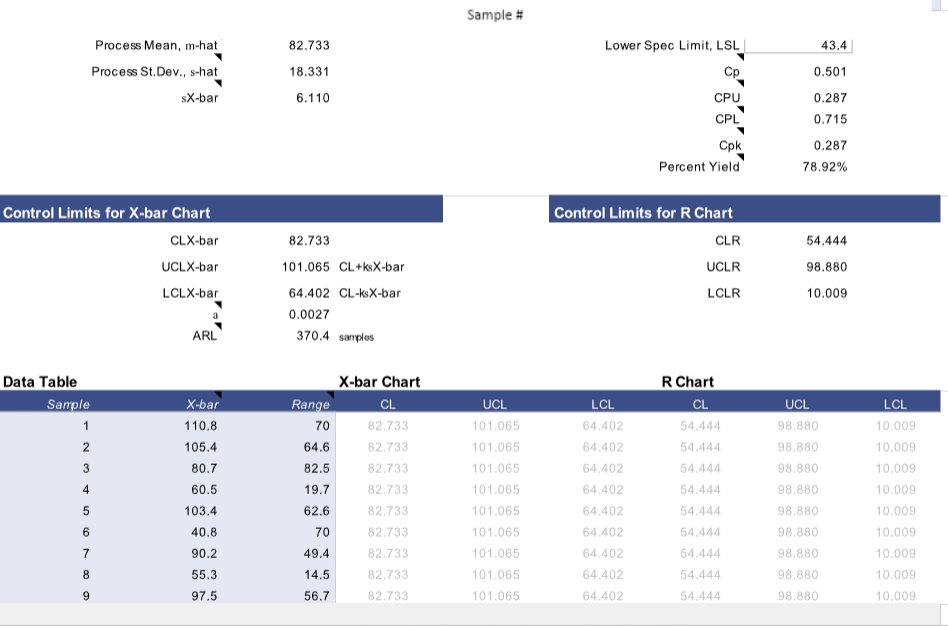
According to the Control Chart data utilized to formulate the chart below, the ideal outcome would be Cpk of 0.475. The planning optimization process would benefit from Lean Six Sigma in order to improve performance by eliminating waste and defects in the process.
Sample \# \begin{tabular}{|c|c|c|c|} \hline Process Mean, m-hat & 82.733 & Lower Spec Limit, LSL & 43.4 \\ \hline Process St.Dev., s-hat & 18.331 & Cp & 0.501 \\ \hline \multirow[t]{4}{*}{ sX-bar } & 6.110 & CPU & 0.287 \\ \hline & & CPL & 0.715 \\ \hline & & Cpk & 0.287 \\ \hline & & Percent Yield & 78.92% \\ \hline \end{tabular} Control Limits for X-bar Chart CLX-barUCLX-barLCLX-barARL82.733101.065CL+ksX-bar64.402CL-ksX-bar0.0027370.4samples Control Limits for R Chart CLRUCLRLCLR54.44498.88010.009 Data Table X-bar Chart R Chart \begin{tabular}{|c|c|c|c|c|c|c|c|c|} \hline Sample & x-bar & Range & CL & UCL & LCL & CL & UCL & LCL \\ \hline 1 & 110.8 & 70 & 82.733 & 101.065 & 64,402 & 54.444 & 98.880 & 10.009 \\ \hline 2 & 105.4 & 64.6 & 82.733 & 101.065 & 64.402 & 54.444 & 98.880 & 10.009 \\ \hline 3 & 80.7 & 82.5 & 82.733 & 101.065 & 64.402 & 54.444 & 98.880 & 10.009 \\ \hline 4 & 60.5 & 19.7 & 82.733 & 101.065 & 64.402 & 54.444 & 98.880 & 10.009 \\ \hline 5 & 103.4 & 62.6 & 82.733 & 101.065 & 64.402 & 54.444 & 98.880 & 10.009 \\ \hline 6 & 40.8 & 70 & 82.733 & 101.065 & 64.402 & 54.444 & 98.880 & 10.009 \\ \hline 7 & 90.2 & 49.4 & 82.733 & 101.065 & 64.402 & 54.444 & 98.880 & 10.009 \\ \hline 8 & 55.3 & 14.5 & 82.733 & 101.065 & 64.402 & 54.444 & 98.880 & 10.009 \\ \hline 9 & 97.5 & 56.7 & 82.733 & 101.065 & 64.402 & 54.444 & 98.880 & 10.009 \\ \hline \end{tabular}
Step by Step Solution
There are 3 Steps involved in it

Get step-by-step solutions from verified subject matter experts