

Question: Convert the dataset into a table that recognizes the headers. Name the table Orders. Use a soft green banding. Rename the worksheet as Orders. In
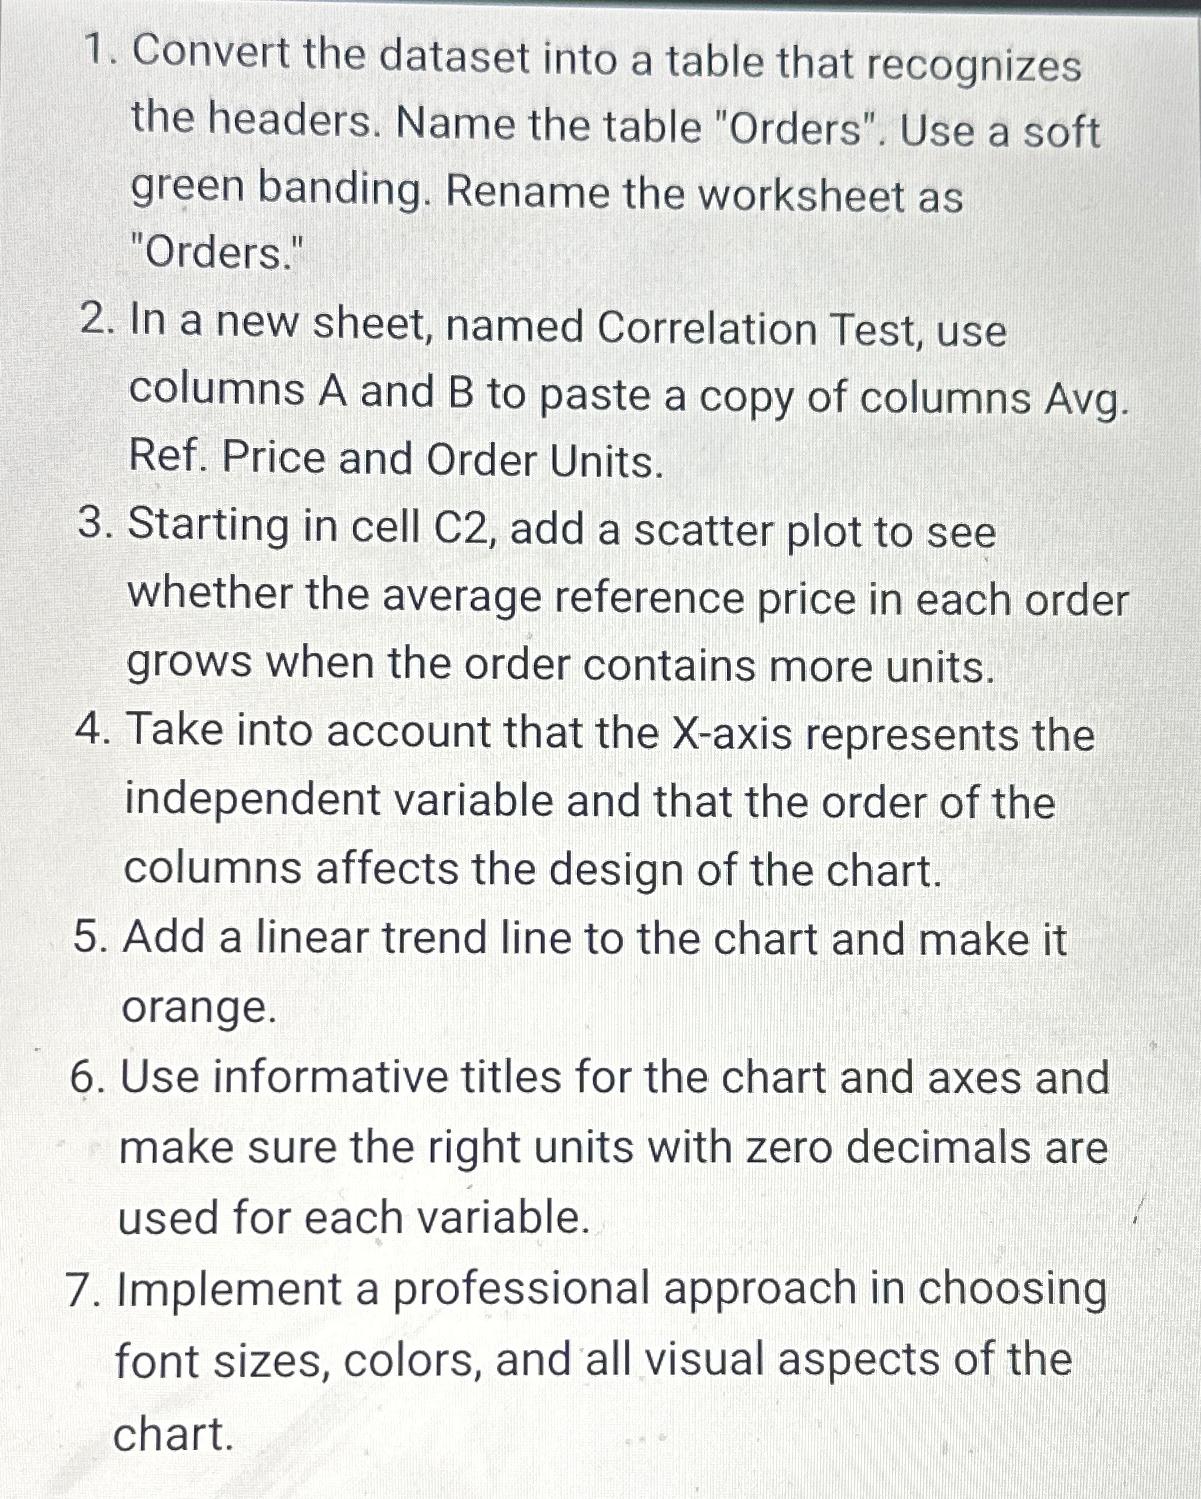
Convert the dataset into a table that recognizes the headers. Name the table "Orders". Use a soft green banding. Rename the worksheet as "Orders."
In a new sheet, named Correlation Test, use columns A and B to paste a copy of columns Avg. Ref. Price and Order Units.
Starting in cell C add a scatter plot to see whether the average reference price in each order grows when the order contains more units.
Take into account that the Xaxis represents the independent variable and that the order of the columns affects the design of the chart.
Add a linear trend line to the chart and make it orange.
Use informative titles for the chart and axes and make sure the right units with zero decimals are used for each variable.
Implement a professional approach in choosing font sizes, colors, and all visual aspects of the chart.
Step by Step Solution
There are 3 Steps involved in it
1 Expert Approved Answer
Step: 1 Unlock

Question Has Been Solved by an Expert!
Get step-by-step solutions from verified subject matter experts
Step: 2 Unlock
Step: 3 Unlock