

Question: Converting from Arrival Forecasts to Room Night Forecasts Date Forecasted Arrivals Stayovers Room Nights 1-N 2-N 3-N 6-Jul 80 10 0 60 7-Jul 40 90
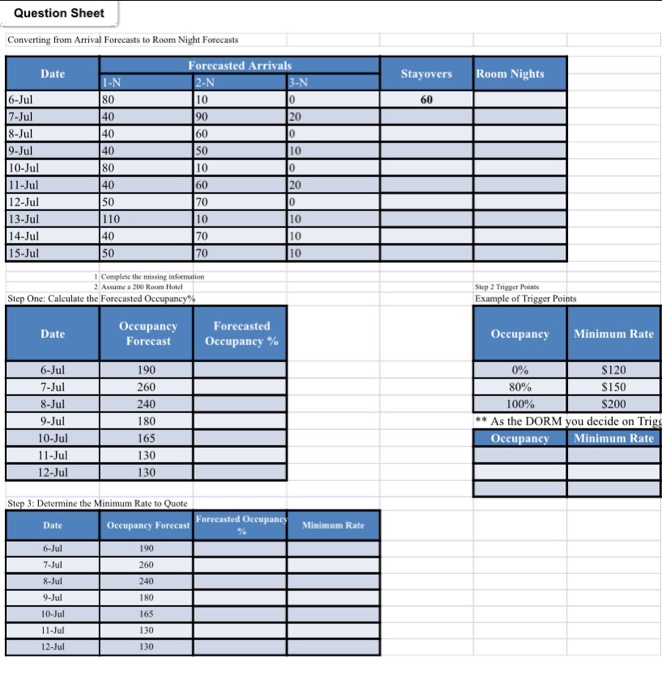
Room Nights Stayovers 60 Question Sheet Converting from Arrival Forecasts to Room Night Forecasts Date Forecasted Arrivals I-N 2-N 3-N 6-Jul 80 10 10 7-Jul 40 90 20 8-Jul 40 160 10 9-Jul 40 50 10 10-Jul 80 10 10 11-Jul 40 20 12-Jul 50 70 0 13-Jul 110 10 10 14-Jul 40 70 10 15-Jul 50 70 10 60 I Complete the missing information 2 Assume a 200 Room Hotel Step One: Calculate the Forecasted Occupancy% Step 2 Trigger Point Example of Trigger Points Date Occupancy Forecast Forecasted Occupancy % Occupancy Minimum Rate 6-Jul 7-Jul 8-Jul 9-Jul 10-Jul 11-Jul 12-Jul 190 260 240 180 165 130 0% $120 80% S150 100% S200 ** As the DORM you decide on Trigs Occupancy Minimum Rate 130 Step 3: Determine the Minimum Rate to Quote Date Occupancy Forecast Forecasted Occupancy Minimum Rate 6-Jul 7-Jul 8-Jul 190 260 240 180 9- Jul 165 10-Jul 11-Jul 12-Jul 130 130 Room Nights Stayovers 60 Question Sheet Converting from Arrival Forecasts to Room Night Forecasts Date Forecasted Arrivals I-N 2-N 3-N 6-Jul 80 10 10 7-Jul 40 90 20 8-Jul 40 160 10 9-Jul 40 50 10 10-Jul 80 10 10 11-Jul 40 20 12-Jul 50 70 0 13-Jul 110 10 10 14-Jul 40 70 10 15-Jul 50 70 10 60 I Complete the missing information 2 Assume a 200 Room Hotel Step One: Calculate the Forecasted Occupancy% Step 2 Trigger Point Example of Trigger Points Date Occupancy Forecast Forecasted Occupancy % Occupancy Minimum Rate 6-Jul 7-Jul 8-Jul 9-Jul 10-Jul 11-Jul 12-Jul 190 260 240 180 165 130 0% $120 80% S150 100% S200 ** As the DORM you decide on Trigs Occupancy Minimum Rate 130 Step 3: Determine the Minimum Rate to Quote Date Occupancy Forecast Forecasted Occupancy Minimum Rate 6-Jul 7-Jul 8-Jul 190 260 240 180 9- Jul 165 10-Jul 11-Jul 12-Jul 130 130
Step by Step Solution
There are 3 Steps involved in it

Get step-by-step solutions from verified subject matter experts