

Question: CoolWipes Case: Excel Solver Designing the Production Network at CoolWipes Matt O'Grady, vice president of supply chain at CoolWipes, thought that his current production and
CoolWipes Case: Excel Solver
Designing the Production Network at CoolWipes
Matt O'Grady, vice president of supply chain at CoolWipes, thought that his current production and distribution network was not appropriate, given the significant increase in transportation costs over the past few years. Compared to when the company had set up its production facility in Chicago, transportation costs and increased by a factor of more than four and were expected to continue growing in the next few years. A quick decision on building one or more new plants could save the company significant amounts in transportation expense in the future.
CoolWipes
CoolWipes was founded in the late 1980s and produced baby wipes and diaper ointment. Annual demand for the two products was as shown in Table 5-14.
At that time, the company had one factory in Chicago that produced both products for the entire country. The wipes line in the Chicago facility had an annual capacity of 5 million units, an annualized fixed cost of $5 million a year, and a variable production cost of $10 per unit. The ointment line in the Chicago facility had an annual capacity of 1 million units, an annualized fixed cost of $1.5 million a year, and a variable production cost of $20 per unit. In addition, the transportation costs per unit (for both wipes and ointment) are shown in Table 5-15.
New Network Options
Matt had identified Princeton, New Jersey; Atlanta; and Los Angeles as potential sites for new plants. Each new plant could have a wipes line, an ointment line, or both. A new wipes line had an annual capacity of 2 million units, an annual fixed cost of $2.2 million, and a variable production cost of $10 per unit. A new ointment line had an annual capacity of 1 million units, an annual fixed cost of $1.5 million, and a variable production cost of $20 per unit. The transportation costs per unit are shown in Table 5-15. Matt had to decide whether to build a new plant and if so, which production lines to put into the new plant.
Study Questions
Matt wants to redesign the whole network to minimize the total costs (i.e., production and transportation cost) of both products.
- What should be recommended to Matt regarding adding any new plant(s)?
- Should he shut down the Chicago plant?
- What production network should Matt adopt?
Provide guidance using Excel Solver to determine the lowest-cost network plan.
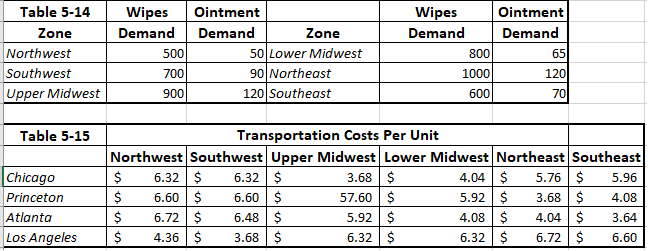
Table 5-14 Wipes Ointment Wipes Ointment Zone Demand Demand Zone Demand Demand Northwest 500 50 Lower Midwest 800 65 Southwest 700 90 Northeast 1000 120 Upper Midwest 900 120 |Southeast 600 70 Table 5-15 Transportation Costs Per Unit Northwest Southwest Upper Midwest Lower Midwest Northeast Southeast Chicago S 6.32 S 6.32 S 3.68 S 4.04 5.76 S 5.96 Princeton S 6.60 6.60 S 57.60 S 5.92 S 3.68 S 4.08 Atlanta S 6.72 S 6.48 S 5.92 S 4.08 S 4.04 S 3.64 Los Angeles S 4.36 S 3.68 S 6.32 S 6.32 S 6.72 S 6.60
Step by Step Solution
There are 3 Steps involved in it

Get step-by-step solutions from verified subject matter experts