

Question: Copy and paste matlab script Activity # 5 Create Graphs in Matlab (5 pts) Matlab plot commands Figure o Figure creates a new figure window
Copy and paste matlab script
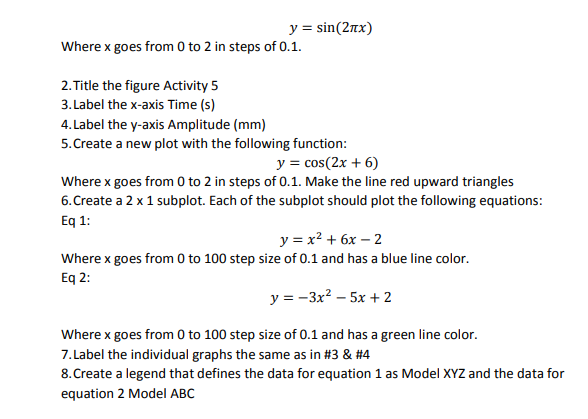
Activity # 5 Create Graphs in Matlab (5 pts) Matlab plot commands Figure o Figure creates a new figure window for data to be displayed o Plots data in a figure o Hold on overlays all data that is to be plotted on one figure o Subplot allows multiple sets of data to be displayed in different plots but in . Plot Hold on . Subplot the same figure Example o Figure Ele Edt ew Insert Iools Desktop Window Help 15 25 30 AY 15 25 AZ 15 20 25 30 Figure 5: Example Subplot Labels All of the following command purposes can be inferred o xlabel o ylabel o legend o title 1. In the command window enter help plot. Plot the following function
Step by Step Solution
There are 3 Steps involved in it

Get step-by-step solutions from verified subject matter experts