

Question: Correlation and Regression 1. Below is a data set with brain weight (in grams) and IQ. a. Make a scatterplot of the data. IQ
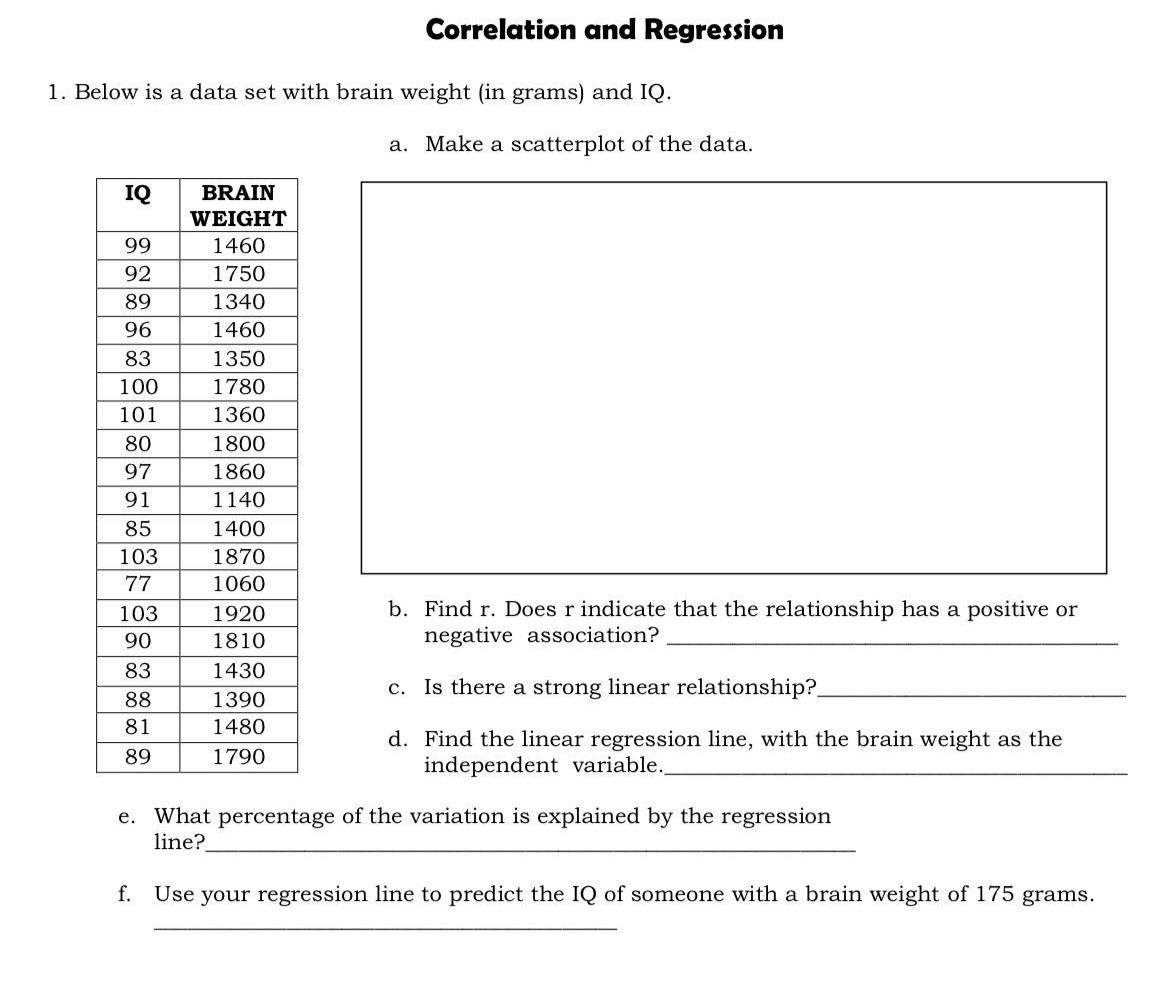
Correlation and Regression 1. Below is a data set with brain weight (in grams) and IQ. a. Make a scatterplot of the data. IQ BRAIN WEIGHT 99 1460 92 1750 89 1340 96 1460 83 1350 100 1780 101 1360 80 1800 97 1860 91 1140 85 1400 103 1870 77 1060 103 1920 90 1810 83 1430 88 1390 b. Find r. Does r indicate that the relationship has a positive or negative association? c. Is there a strong linear relationship? 81 1480 89 1790 d. Find the linear regression line, with the brain weight as the independent variable.. e. What percentage of the variation is explained by the regression f. line? Use your regression line to predict the IQ of someone with a brain weight of 175 grams.
Step by Step Solution
There are 3 Steps involved in it
A Make a scatter plo t Explanation Only obvious relations can be detected looking at the graph Statistics will be useful in determination of relationships between the two variables and also to predict ... View full answer

Get step-by-step solutions from verified subject matter experts