

Question: Cost data begin{tabular}{|lr|} hline Wage/hour & $12.00 OT pay rate & $16.00 hline Subcontracting rate/unit & $70.00 Carrying cost & $5.00
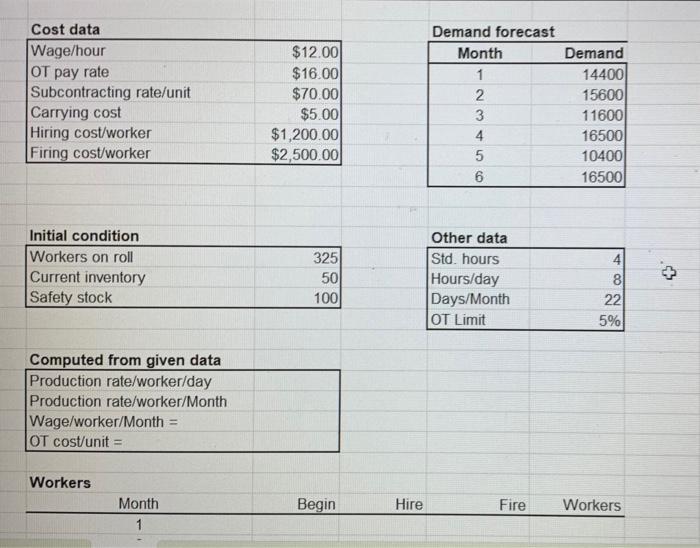
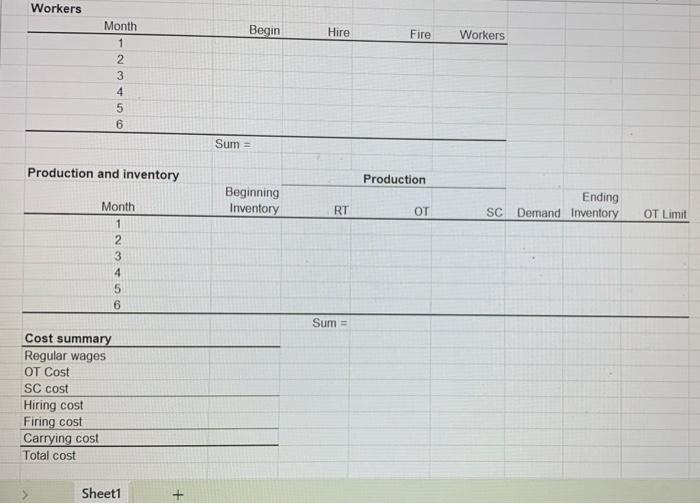
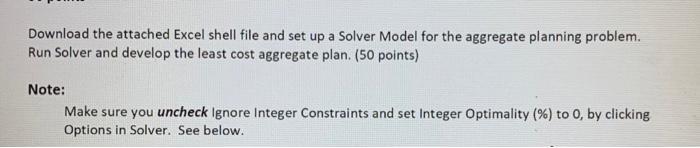
Cost data \begin{tabular}{|lr|} \hline Wage/hour & $12.00 \\ OT pay rate & $16.00 \\ \hline Subcontracting rate/unit & $70.00 \\ Carrying cost & $5.00 \\ Hiring cost/worker & $1,200.00 \\ Firing cost/worker & $2,500.00 \\ \hline \end{tabular} Initial condition \begin{tabular}{|lr|} \hline Workers on roll & 325 \\ Current inventory & 50 \\ Safety stock & 100 \\ \hline \end{tabular} Computed from given data Production rate/worker/day Production rate/worker/Month Wage/worker/Month = OT cost/unit = Workers Demand forecast \begin{tabular}{|cr|} \hline Month & Demand \\ \hline 1 & 14400 \\ 2 & 15600 \\ 3 & 11600 \\ 4 & 16500 \\ 5 & 10400 \\ 6 & 16500 \\ \hline \end{tabular} Other data \begin{tabular}{|lr|} \hline Std. hours & 4 \\ Hours/day & 8 \\ Days/Month & 22 \\ OT Limit & 5% \\ \hline \end{tabular} \begin{tabular}{ccccc} Month & Begin & Hire & Fire & Workers \\ \hline 1 & & & \end{tabular} Workers Sheet1 Download the attached Excel shell file and set up a Solver Model for the aggregate planning problem. Run Solver and develop the least cost aggregate plan. (50 points) Note: Make sure you uncheck Ignore Integer Constraints and set Integer Optimality (%) to 0 , by clicking Options in Solver. See below. Cost data \begin{tabular}{|lr|} \hline Wage/hour & $12.00 \\ OT pay rate & $16.00 \\ \hline Subcontracting rate/unit & $70.00 \\ Carrying cost & $5.00 \\ Hiring cost/worker & $1,200.00 \\ Firing cost/worker & $2,500.00 \\ \hline \end{tabular} Initial condition \begin{tabular}{|lr|} \hline Workers on roll & 325 \\ Current inventory & 50 \\ Safety stock & 100 \\ \hline \end{tabular} Computed from given data Production rate/worker/day Production rate/worker/Month Wage/worker/Month = OT cost/unit = Workers Demand forecast \begin{tabular}{|cr|} \hline Month & Demand \\ \hline 1 & 14400 \\ 2 & 15600 \\ 3 & 11600 \\ 4 & 16500 \\ 5 & 10400 \\ 6 & 16500 \\ \hline \end{tabular} Other data \begin{tabular}{|lr|} \hline Std. hours & 4 \\ Hours/day & 8 \\ Days/Month & 22 \\ OT Limit & 5% \\ \hline \end{tabular} \begin{tabular}{ccccc} Month & Begin & Hire & Fire & Workers \\ \hline 1 & & & \end{tabular} Workers Sheet1 Download the attached Excel shell file and set up a Solver Model for the aggregate planning problem. Run Solver and develop the least cost aggregate plan. (50 points) Note: Make sure you uncheck Ignore Integer Constraints and set Integer Optimality (%) to 0 , by clicking Options in Solver. See below
Step by Step Solution
There are 3 Steps involved in it

Get step-by-step solutions from verified subject matter experts