

Question: The figure below shows a graph of a cost function C(x) and a linear revenue function R(x). Briefly describe what is occurring at the
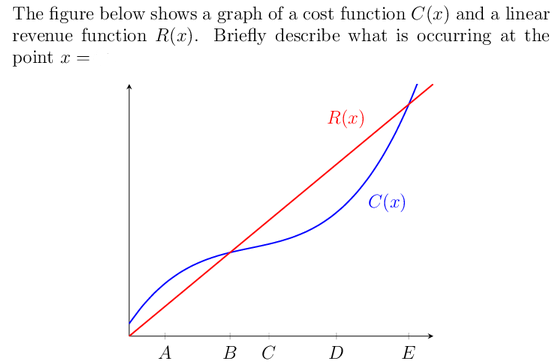
The figure below shows a graph of a cost function C(x) and a linear revenue function R(x). Briefly describe what is occurring at the point a = R(x) C(x) A D E
Step by Step Solution
★★★★★
3.42 Rating (158 Votes )
There are 3 Steps involved in it
1 Expert Approved Answer
Step: 1 Unlock

answer Linear Revenue and Profit Functions Revenue results from the sale of items and profit is the ... View full answer
Question Has Been Solved by an Expert!
Get step-by-step solutions from verified subject matter experts
Step: 2 Unlock
Step: 3 Unlock