

Question: Could I get some assistance on this, I'm having a hard time understanding how to read this graph. MAT 133: Ch. 3 Review WS p.3
Could I get some assistance on this, I'm having a hard time understanding how to read this graph.
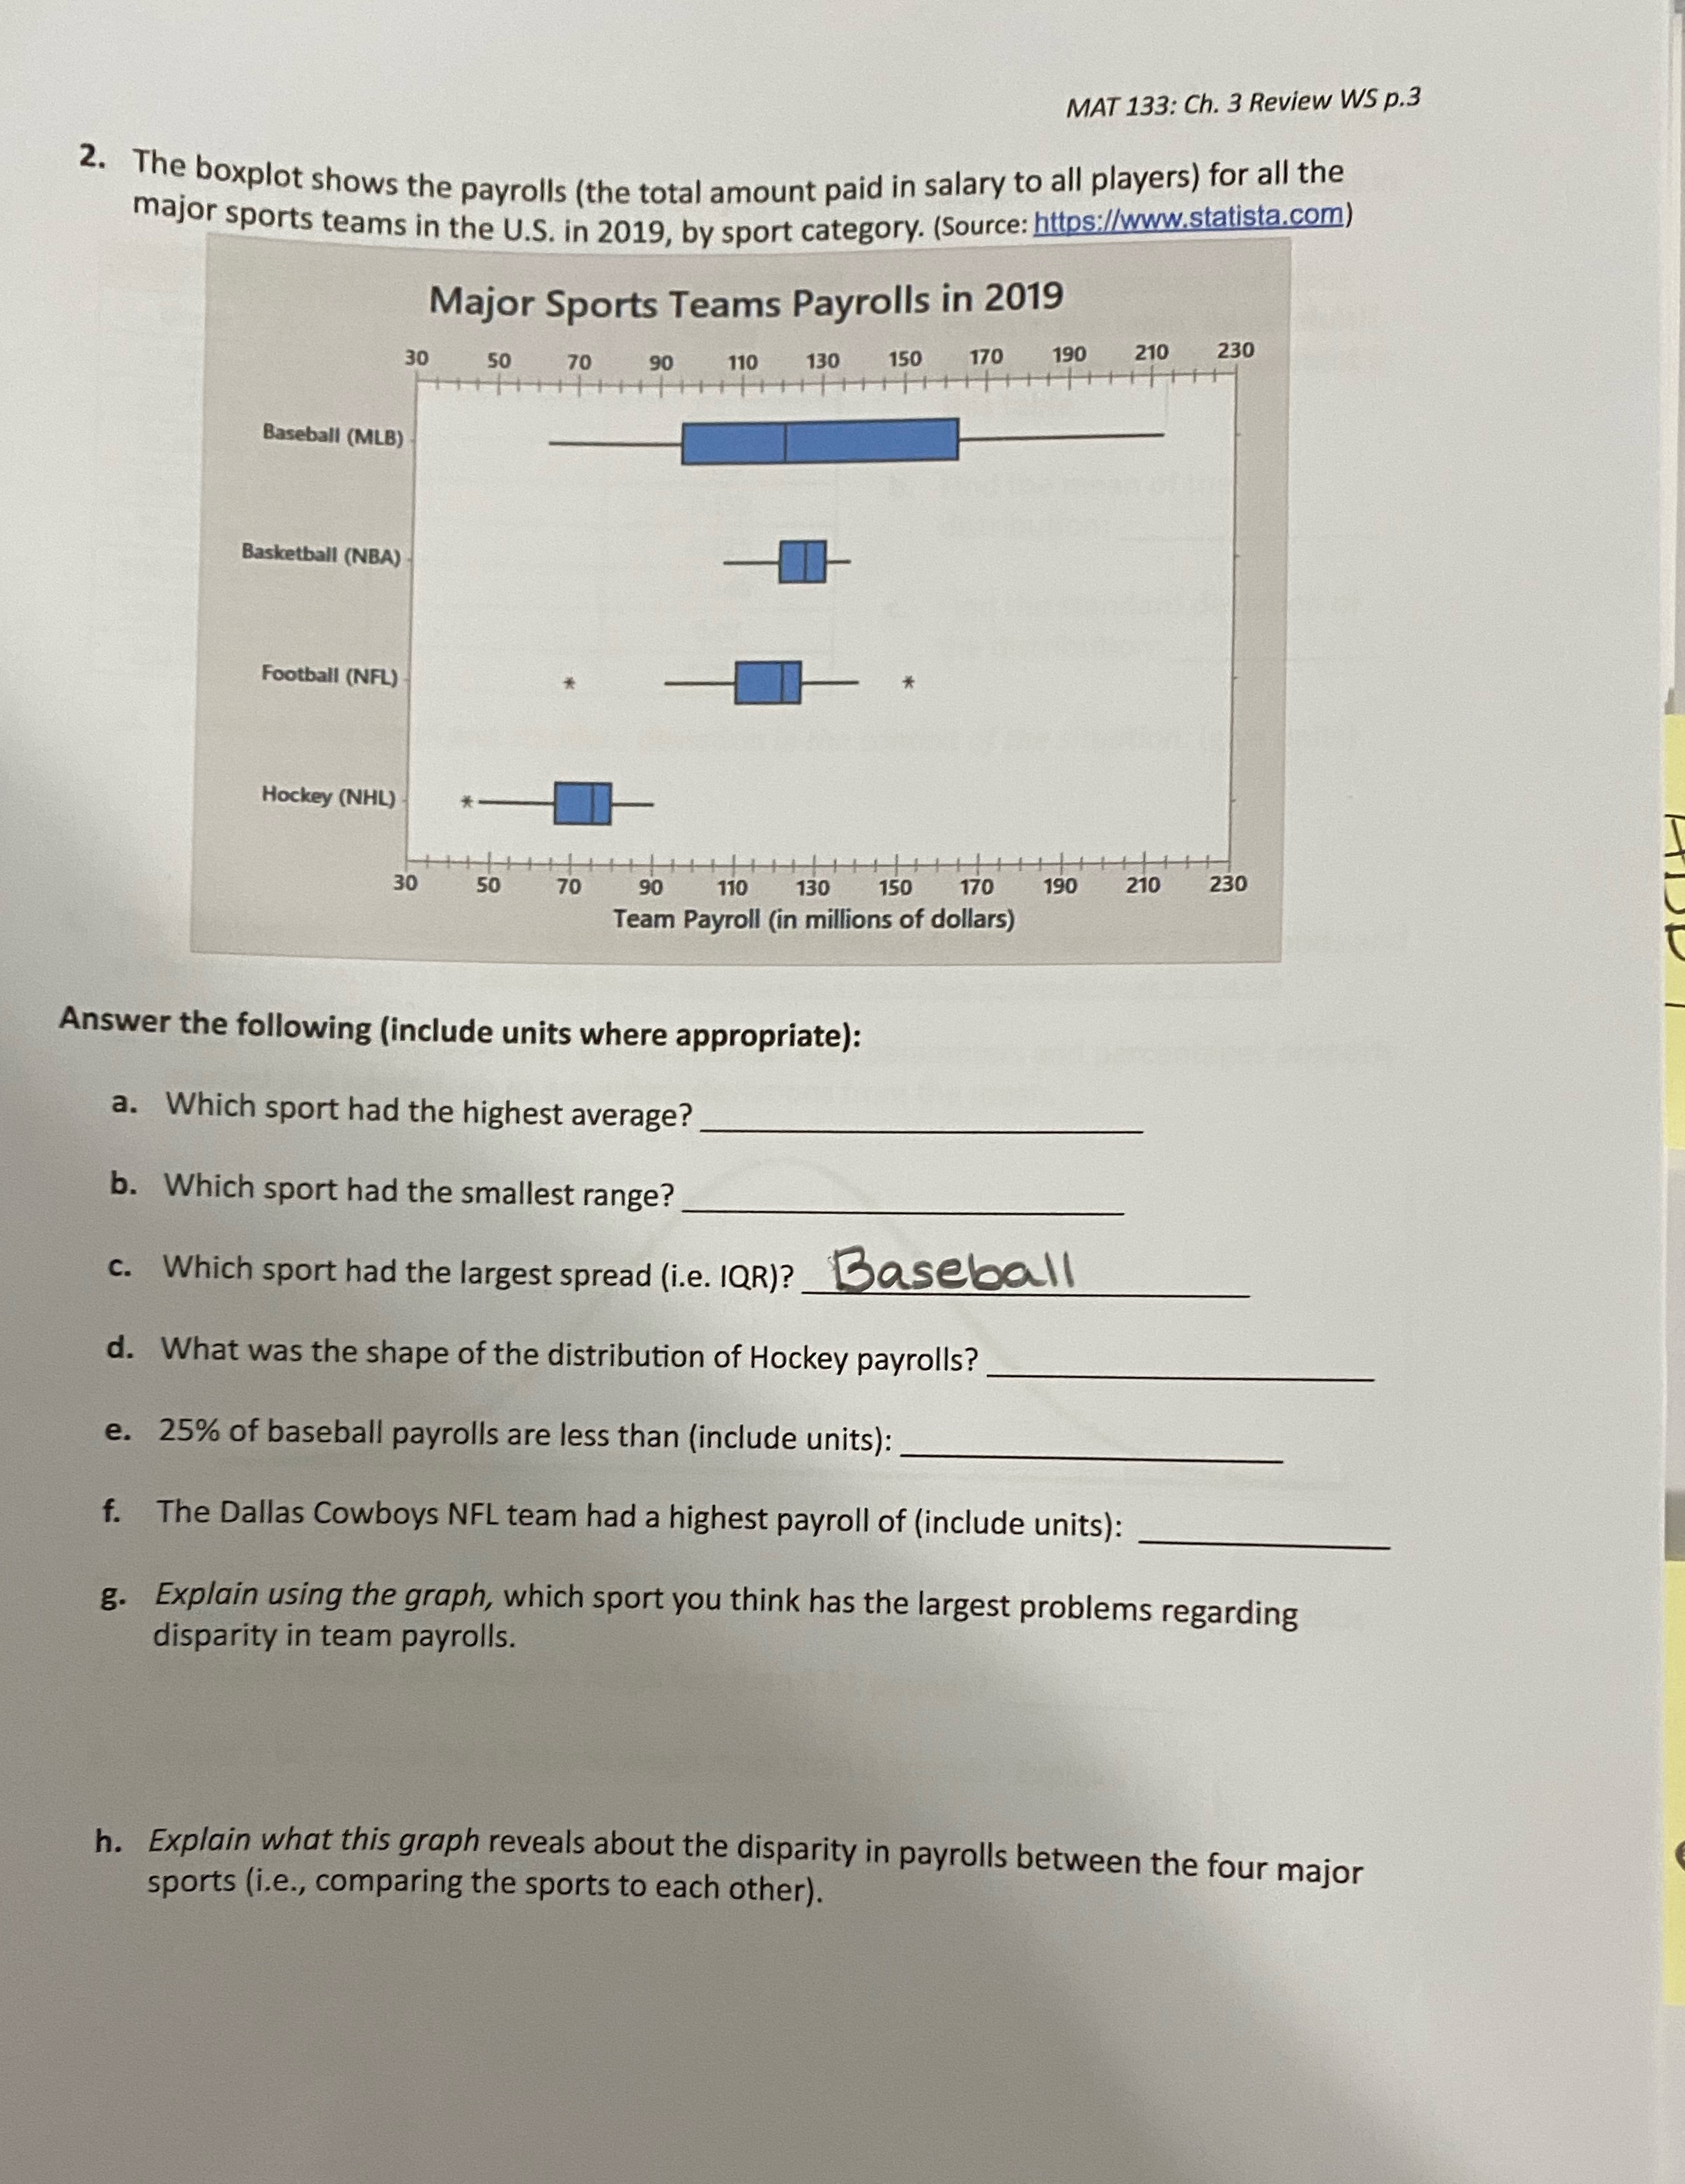
MAT 133: Ch. 3 Review WS p.3 2. The boxplot shows the payrolls (the total amount paid in salary to all players) for all the major sports teams in the U.S. in 2019, by sport category. (Source: https://www.statista.com) Major Sports Teams Payrolls in 2019 30 50 70 90 110 130 150 170 190 210 230 Baseball (MLB) Basketball (NBA) Football (NFL) Hockey (NHL) 30 50 70 90 110 130 150 170 190 210 230 Team Payroll (in millions of dollars) Answer the following (include units where appropriate): a. Which sport had the highest average? b. Which sport had the smallest range? c. Which sport had the largest spread (i.e. IQR)? _Baseball d. What was the shape of the distribution of Hockey payrolls? e. 25% of baseball payrolls are less than (include units): f. The Dallas Cowboys NFL team had a highest payroll of (include units): g. Explain using the graph, which sport you think has the largest problems regarding disparity in team payrolls. h. Explain what this graph reveals about the disparity in payrolls between the four major sports (i.e., comparing the sports to each other)
Step by Step Solution
There are 3 Steps involved in it

Get step-by-step solutions from verified subject matter experts