Question: Could someone explain to me how I would do each step in excel? This is the Pivot Table with everything selected, I'm not sure where
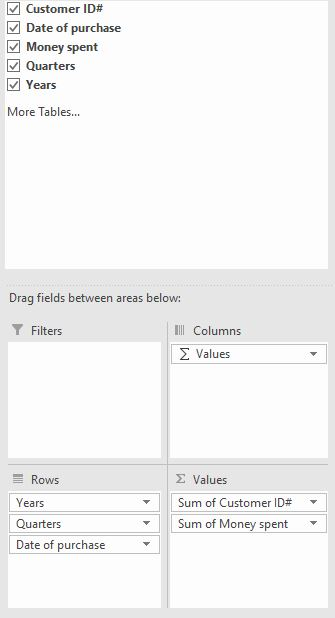
Could someone explain to me how I would do each step in excel?
This is the Pivot Table with everything selected, I'm not sure where each should go for what.
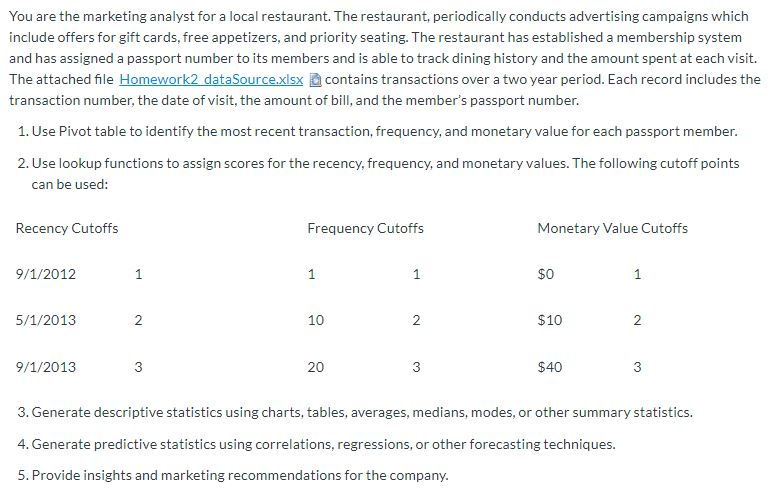
You are the marketing analyst for a local restaurant. The restaurant, periodically conducts advertising campaigns which include offers for gift cards, free appetizers, and priority seating. The restaurant has established a membership system and has assigned a passport number to its members and is able to track dining history and the amount spent at each visit. The attached file Homework2 dataSource.xlsx contains transactions over a two year period. Each record includes the transaction number, the date of visit, the amount of bill, and the member's passport number. 1. Use Pivot table to identify the most recent transaction, frequency, and monetary value for each passport member. 2. Use lookup functions to assign scores for the recency, frequency, and monetary values. The following cutoff points can be used: Recency Cutoffs Frequency Cutoffs Monetary Value Cutoffs 9/1/2012 1 1 1 $0 1 5/1/2013 2 10 2 $10 2 9/1/2013 3 20 3 $40 3 3. Generate descriptive statistics using charts, tables, averages, medians, modes, or other summary statistics. 4. Generate predictive statistics using correlations, regressions, or other forecasting techniques. 5. Provide insights and marketing recommendations for the company. Customer ID# Date of purchase Money spent Quarters Years More Tables... Drag fields between areas below: Filters II Columns Values Rows Years Values Sum of Customer ID# Sum of Money spent Quarters Date of purchase You are the marketing analyst for a local restaurant. The restaurant, periodically conducts advertising campaigns which include offers for gift cards, free appetizers, and priority seating. The restaurant has established a membership system and has assigned a passport number to its members and is able to track dining history and the amount spent at each visit. The attached file Homework2 dataSource.xlsx contains transactions over a two year period. Each record includes the transaction number, the date of visit, the amount of bill, and the member's passport number. 1. Use Pivot table to identify the most recent transaction, frequency, and monetary value for each passport member. 2. Use lookup functions to assign scores for the recency, frequency, and monetary values. The following cutoff points can be used: Recency Cutoffs Frequency Cutoffs Monetary Value Cutoffs 9/1/2012 1 1 1 $0 1 5/1/2013 2 10 2 $10 2 9/1/2013 3 20 3 $40 3 3. Generate descriptive statistics using charts, tables, averages, medians, modes, or other summary statistics. 4. Generate predictive statistics using correlations, regressions, or other forecasting techniques. 5. Provide insights and marketing recommendations for the company. Customer ID# Date of purchase Money spent Quarters Years More Tables... Drag fields between areas below: Filters II Columns Values Rows Years Values Sum of Customer ID# Sum of Money spent Quarters Date of purchase


