

Question: could you explain this graph ive property (all molar quantities are intensive). For certain applications it is useful to know the sp capacity (more informally,
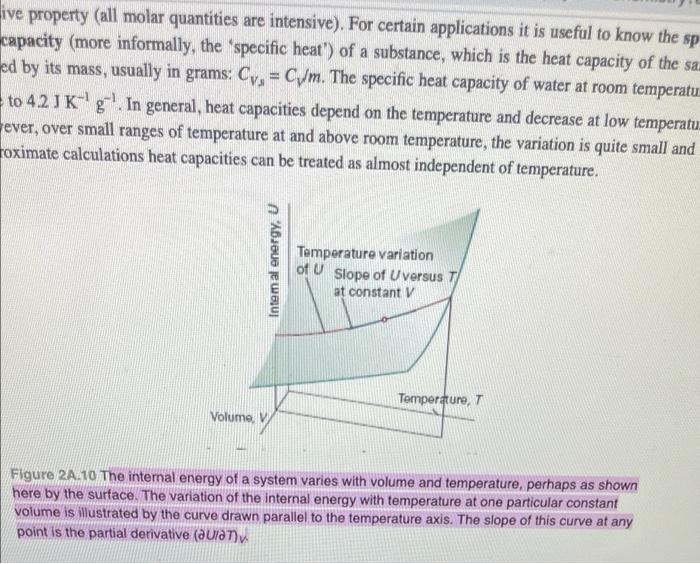
ive property (all molar quantities are intensive). For certain applications it is useful to know the sp capacity (more informally, the specific heat") of a substance, which is the heat capacity of the sa. ed by its mass, usually in grams: Cya = CWm. The specific heat capacity of water at room temperatu to 42JK'g'. In general, heat capacities depend on the temperature and decrease at low temperatu ever, over small ranges of temperature at and above room temperature, the variation is quite small and roximate calculations heat capacities can be treated as almost independent of temperature. Intem al energy, U Temperature variation of U Slope of Uversus T at constant V Temperature, Volume, V Figure 24.10 The internal energy of a system varies with volume and temperature, perhaps as shown here by the surface. The variation of the internal energy with temperature at one particular constant volume is illustrated by the curve drawn parallel to the temperature axis. The slope of this curve at any point is the partial derivative (aula)
Step by Step Solution
There are 3 Steps involved in it

Get step-by-step solutions from verified subject matter experts