

Question: Could you help giving me explanations on this problem ? Thank you. A study was conducted to determine the correlation between gender and the most
Could you help giving me explanations on this problem ? Thank you.
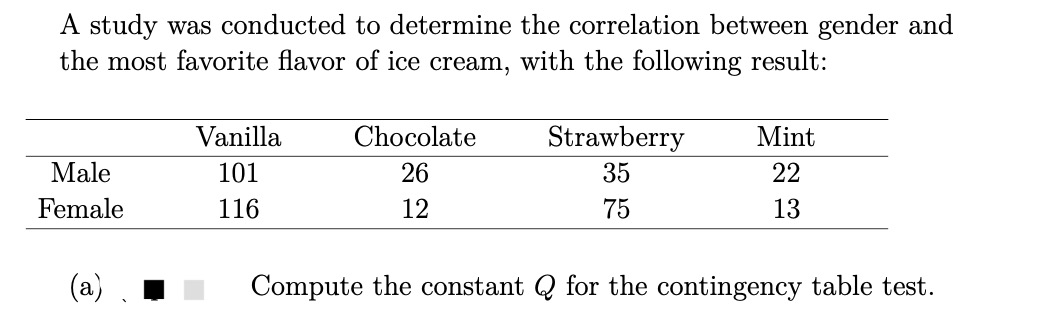
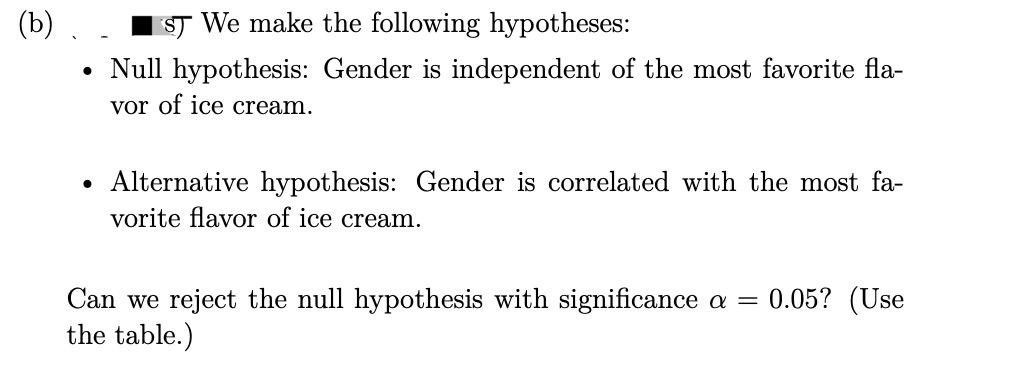
A study was conducted to determine the correlation between gender and the most favorite avor of ice cream, with the following result: Vanilla Chocolate Strawberry Mint Male 101 26 35 22 Female 116 12 75 13 (a) ' - Compute the constant Q for the contingency table test. (b). Is We make the following hypotheses: . Null hypothesis: Gender is independent of the most favorite fla- vor of ice cream. . Alternative hypothesis: Gender is correlated with the most fa- vorite flavor of ice cream. Can we reject the null hypothesis with significance a = 0.05? (Use the table.)
Step by Step Solution
There are 3 Steps involved in it

Get step-by-step solutions from verified subject matter experts