

Question: Could you please explain how to choose a graph for part a and how to solve parts b and c. Thank you! Graphical derivation of

Could you please explain how to choose a graph for part a and how to solve parts b and c. Thank you!
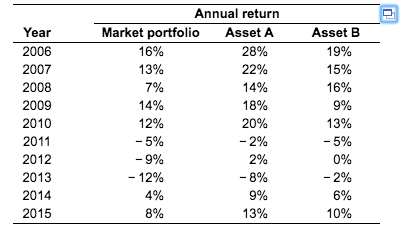
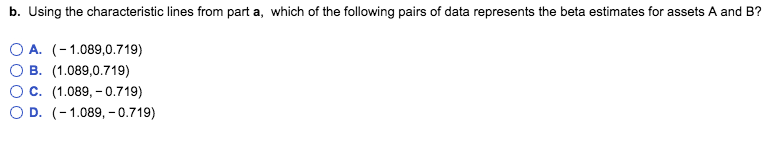
Graphical derivation of beta A firm wishes to estimate graphically the betas for two assets, A and B. It has gathered the return data shown in the following table for the market portfolio and for both assets over the last 10 years, 2006-2015: EE a. Which of the following graphs represents the graphical derivation of beta for assets A and B? b. Use the characteristic lines from part a to estimate the betas for assets A and B c. Use the betas found in part b to comment on the relative risks of assets A and B Annual return Asset AAsset B Market portfolio Year 2006 2007 2008 2009 2010 2011 2012 2013 2014 2015 16% 13% 7% 14% 12% -5% -0% -12% 4% 8% 28% 22% 14% 18% 20% -2% 2% -8% 9% 13% 19% 15% 16% golo 13% -5% 0% -2% 6% 10% b. Using the characteristic lines from part a, which of the following pairs of data represents the beta estimates for assets A and B? O A. (-1.089,0.719) B. (1.089,0.719) O C. (1.089,-0.719) OD. (-1.089,-0.719) Graphical derivation of beta A firm wishes to estimate graphically the betas for two assets, A and B. It has gathered the return data shown in the following table for the market portfolio and for both assets over the last 10 years, 2006-2015: EE a. Which of the following graphs represents the graphical derivation of beta for assets A and B? b. Use the characteristic lines from part a to estimate the betas for assets A and B c. Use the betas found in part b to comment on the relative risks of assets A and B Annual return Asset AAsset B Market portfolio Year 2006 2007 2008 2009 2010 2011 2012 2013 2014 2015 16% 13% 7% 14% 12% -5% -0% -12% 4% 8% 28% 22% 14% 18% 20% -2% 2% -8% 9% 13% 19% 15% 16% golo 13% -5% 0% -2% 6% 10% b. Using the characteristic lines from part a, which of the following pairs of data represents the beta estimates for assets A and B? O A. (-1.089,0.719) B. (1.089,0.719) O C. (1.089,-0.719) OD. (-1.089,-0.719)
Step by Step Solution
There are 3 Steps involved in it

Get step-by-step solutions from verified subject matter experts