

Question: could you please solve to me the second question please ? I need the steps for doing it on Excel A training center wants to

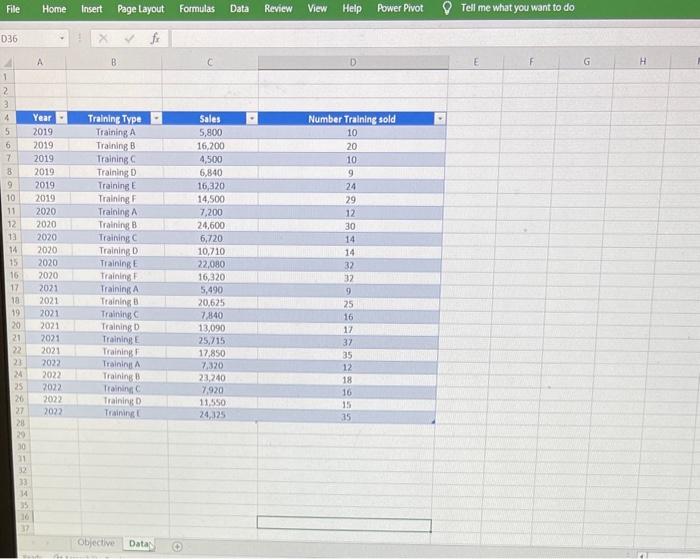
A training center wants to follow the different types of training it offers. For this purpose, it decided to design a dashboard allowing it to visualize the following: 1. Training type according to the Number of Training sold with a possibility to select them according to the year (Use a slicer) 4 Marks 2. Training type according to Sale values (5ales). The proposed chact must offer the possibiity of selection by year (use the previous slicer) 4 Marks 3. Ihe number of training sold by year. 3 Marks 4. A bar dyart showing sum of sales by year. This chart and the just previous one can be selected rozether by training Name. (use a slicer) 4 Marka File Home Insert Pagetayout Formulas Data Review View Help Power Pivot Tell me what you want to do D36
Step by Step Solution
There are 3 Steps involved in it
To solve the second question which requires creating a chart for training type according to Sale val... View full answer

Get step-by-step solutions from verified subject matter experts