

Question: Could you solve the question please? THANK YOU SO MUCH!!! This is a graded discussion: 5 points possible due Aug 7 Discussion: Write about Math
Could you solve the question please? THANK YOU SO MUCH!!!

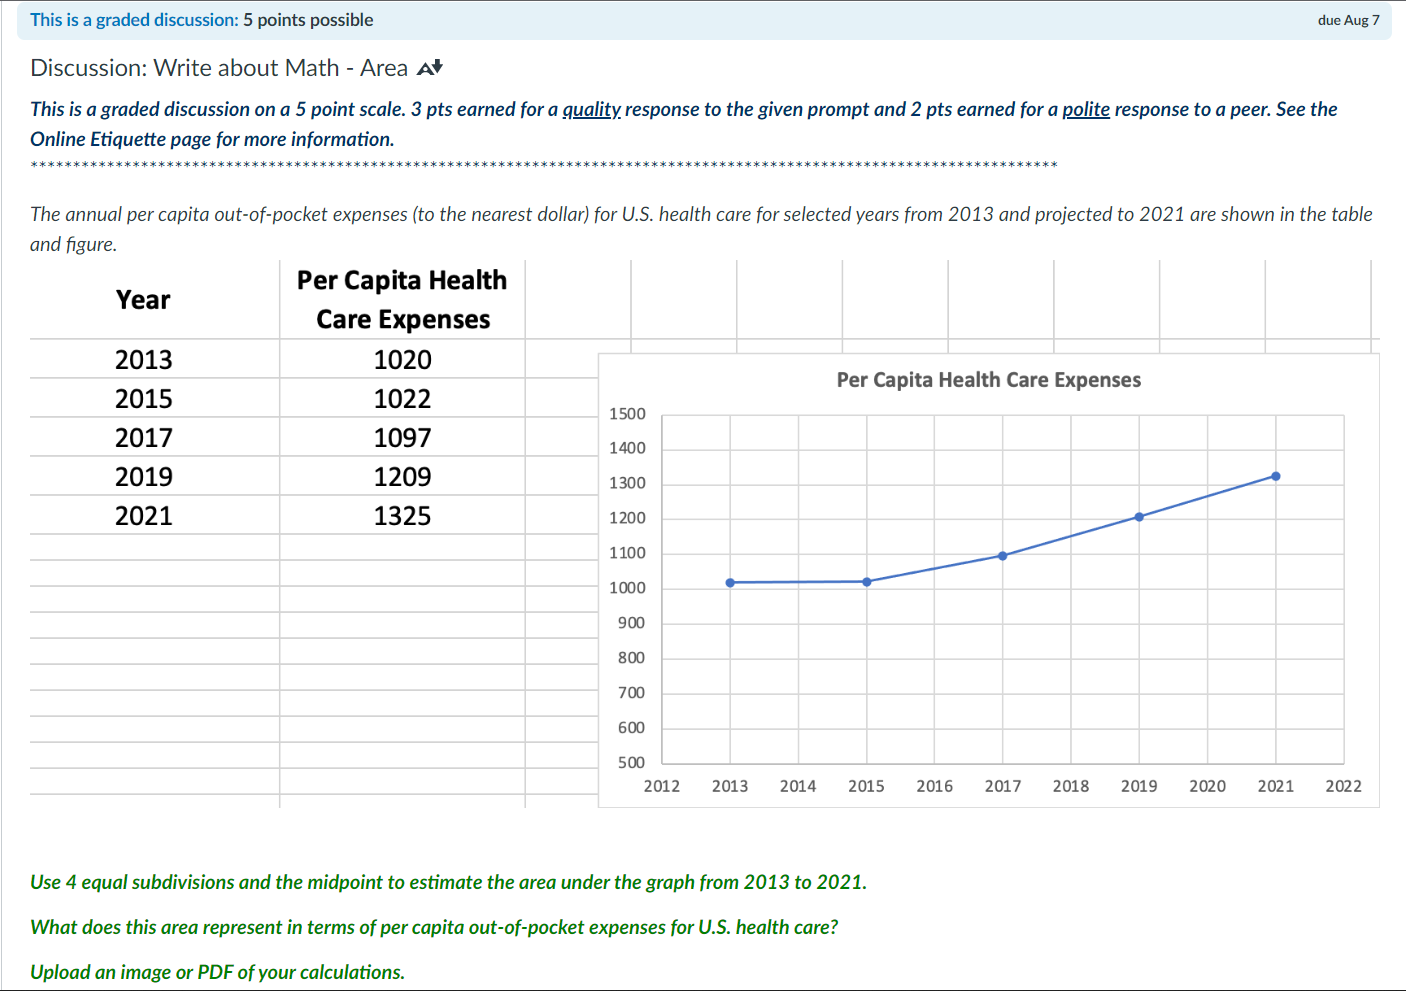
This is a graded discussion: 5 points possible due Aug 7 Discussion: Write about Math - Area At This is a graded discussion on a 5 point scale. 3 pts earned for a quality response to the given prompt and 2 pts earned for a polite response to a peer. See the Online Etiquette page for more information. The annual per capita out-of-pocket expenses (to the nearest dollar) for U.S. health care for selected years from 2013 and projected to 2021 are shown in the table and figure. Per Capita Health Year Care Expenses 2013 1020 Per Capita Health Care Expenses 2015 1022 1500 2017 1097 1400 2019 1209 1300 2021 1325 1200 1100 1000 900 800 700 600 500 2012 2013 2014 2015 2016 2017 2018 2019 2020 2021 2022 Use 4 equal subdivisions and the midpoint to estimate the area under the graph from 2013 to 2021. What does this area represent in terms of per capita out-of-pocket expenses for U.S. health care? Upload an image or PDF of your calculations
Step by Step Solution
There are 3 Steps involved in it

Get step-by-step solutions from verified subject matter experts