

Question: Covariance and Correlation The following table shows the expected returns from six different stocks in three different states of the economy: A) Calculate the expected
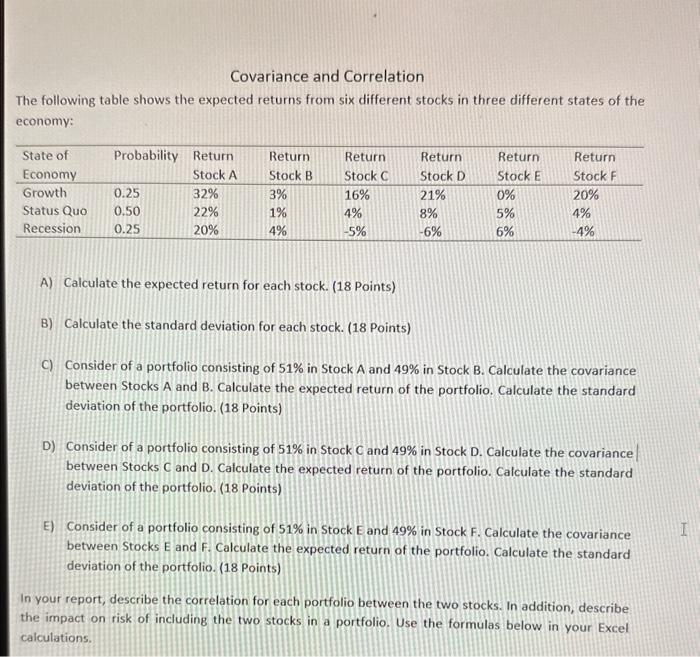
Covariance and Correlation The following table shows the expected returns from six different stocks in three different states of the economy: A) Calculate the expected return for each stock. (18 Points) B) Calculate the standard deviation for each stock. (18 Points) C) Consider of a portfolio consisting of 51% in Stock A and 49% in Stock B. Calculate the covariance between Stocks A and B. Calculate the expected return of the portfolio. Calculate the standard deviation of the portfolio. (18 Points) D) Consider of a portfolio consisting of 51% in Stock C and 49% in Stock D. Calculate the covariance between Stocks C and D. Calculate the expected return of the portfolio. Calculate the standard deviation of the portfolio. (18 Points) E) Consider of a portfolio consisting of 51% in Stock E and 49% in Stock F. Calculate the covariance between Stocks E and F. Calculate the expected return of the portfolio. Calculate the standard deviation of the portfolio. (18 Points) In your report, describe the correlation for each portfolio between the two stocks. In addition, describe the impact on risk of including the two stocks in a portfolio. Use the formulas below in your Excel calculations
Step by Step Solution
There are 3 Steps involved in it

Get step-by-step solutions from verified subject matter experts