

Question: The following table shows the expected returns from six different stocks in three different states of the economy: Consider of a portfolio consisting of 50%
The following table shows the expected returns from six different stocks in three different states of the economy:
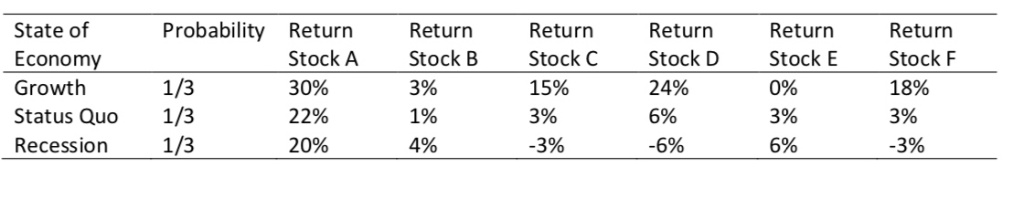
- Consider of a portfolio consisting of 50% in Stock A and 50% in Stock B. Calculate the covariance between Stocks A and B. Calculate the expected return of the portfolio. Calculate the standard deviation of the portfolio
- Consider of a portfolio consisting of 50% in Stock C and 50% in Stock D. Calculate the covariance between Stocks C and D. Calculate the expected return of the portfolio. Calculate the standard deviation of the portfolio
- Consider of a portfolio consisting of 50% in Stock E and 50% in Stock F. Calculate the covariance between Stocks E and F. Calculate the expected return of the portfolio. Calculate the standard deviation of the portfolio
PLEASE EXPLAIN ALL THE STEPS IN DETAILS NO EXCEL WORK
Return Return Stock D 24% 6% 4% Return Return Stock B 3% 196 0% Return StockC 15% 3% 3% Probability Return State of Economy Growth Stock F 1/3 Status Quo 1/3 Recession 1/3 Stock A 30% 22% 20% Stock E 0% 3% 5% 18% 3% -3%
Step by Step Solution
There are 3 Steps involved in it
1 Expert Approved Answer
Step: 1 Unlock

Question Has Been Solved by an Expert!
Get step-by-step solutions from verified subject matter experts
Step: 2 Unlock
Step: 3 Unlock