

Question: Please show the process For the next six questions, use the following table showing the expected returns from six different stocks in three different states
Please show the process
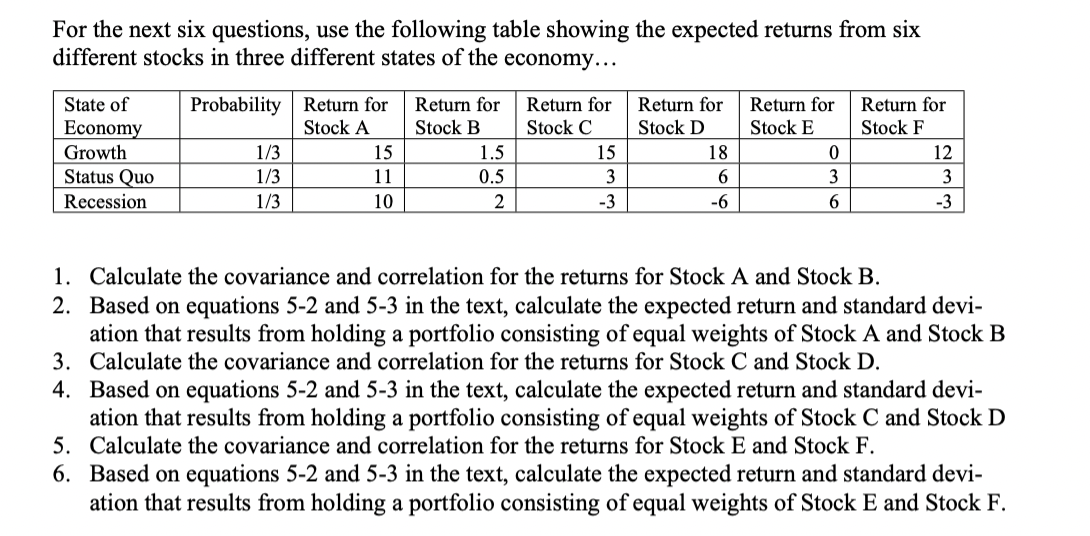
For the next six questions, use the following table showing the expected returns from six different stocks in three different states of the economy... State of Economy Growth Status Quo Recession Probability Return for Stock A 1/3 15 1/3 11 10 Return for Stock B 1.5 0.5 2 Return for Stock C 15 3 -3 Return for Stock D 18 6 -6 Return for Stock E 0 3 Return for Stock F 12 3 -3 1/3 6 1. Calculate the covariance and correlation for the returns for Stock A and Stock B. 2. Based on equations 5-2 and 5-3 in the text, calculate the expected return and standard devi- ation that results from holding a portfolio consisting of equal weights of Stock A and Stock B 3. Calculate the covariance and correlation for the returns for Stock C and Stock D. 4. Based on equations 5-2 and 5-3 in the text, calculate the expected return and standard devi- ation that results from holding a portfolio consisting of equal weights of Stock C and Stock D 5. Calculate the covariance and correlation for the returns for Stock E and Stock F. 6. Based on equations 5-2 and 5-3 in the text, calculate the expected return and standard devi- ation that results from holding a portfolio consisting of equal weights of Stock E and Stock F
Step by Step Solution
There are 3 Steps involved in it

Get step-by-step solutions from verified subject matter experts