

Question: #crayons.bmp #crayons.jpg import numpy as np import cv2 import matplotlib.image as mpimg import matplotlib.pyplot as plt import skimage import scipy %matplotlib inline IMG_DIR = 'images/'
#crayons.bmp
#crayons.jpg

import numpy as np import cv2 import matplotlib.image as mpimg import matplotlib.pyplot as plt import skimage import scipy %matplotlib inline
IMG_DIR = 'images/' IMG_NAME = 'crayons.bmp'
def read_image(IMG_NAME): img = mpimg.imread(IMG_NAME) return img
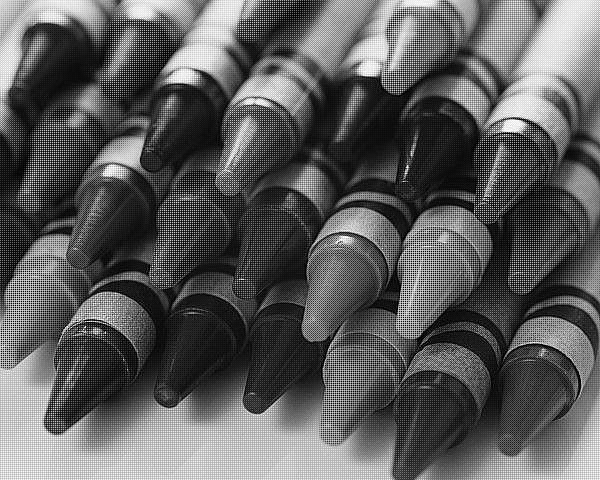
# For a sanity check, display your image here print(IMG_NAME) mosaic_img = read_image(IMG_DIR+IMG_NAME) plt.imshow(mosaic_img)
### HINT : You might want to use filters
### HINT : To use filters you might want to write your kernels
### HINT : For writing your kernels you might want to see the RGB Pattern provided on the website
### HINT : To improve your kernels, you might want to use the squared difference ### between your solution image and the original image
def get_solution_image(mosaic_img): ''' This function should return the soln image. Feel free to write helper functions in the above cells as well as change the parameters of this function. ''' mosaic_shape = np.shape(mosaic_img) soln_image = np.zeros((mosaic_shape[0], mosaic_shape[1], 3)) ### YOUR CODE HERE ### return soln_image
def compute_errors(soln_image, original_image): ''' Compute the Average and Maximum per-pixel error for the image. Also generate the map of pixel differences to visualize where the mistakes are made ''' return pp_err, max_err
mosaic_img = read_image('crayons.bmp') soln_image = get_solution_image(mosaic_img) original_image = read_image('crayons.jpg') # For sanity check display your solution image here ### YOUR CODE
pp_err, max_err = compute_errors(soln_image, original_image) print("The average per-pixel error for crayons is: "+str(pp_err)) print("The maximum per-pixel error for crayons is: "+str(max_err))
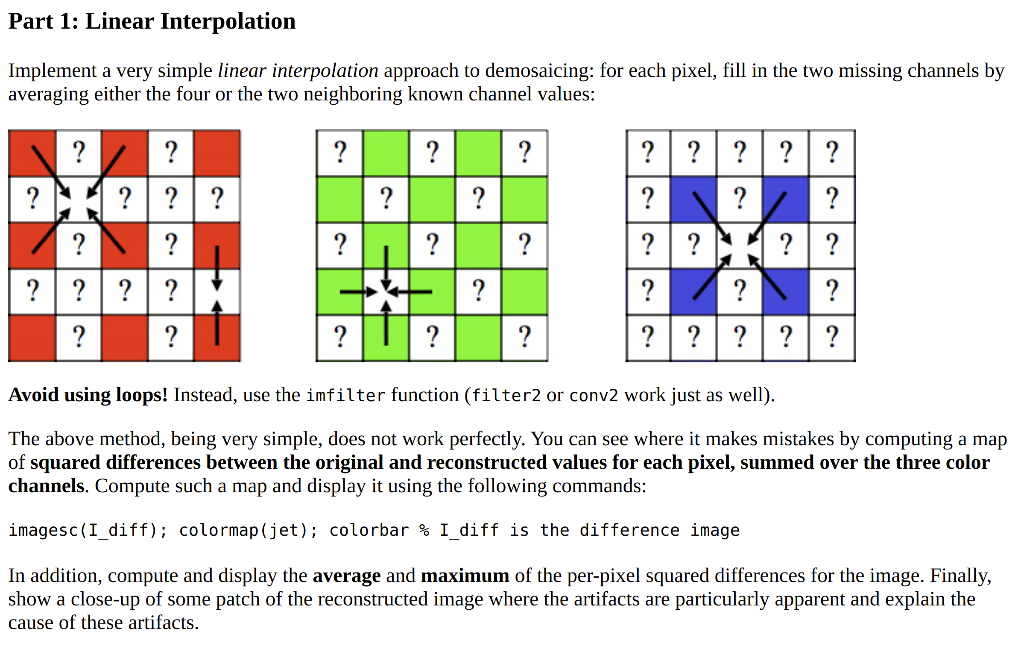
Part 1: Linear Interpolation Implement a very simple linear interpolation approach to demosaicing: for each pixel, fill in the two missing channels by averaging either the four or the two neighboring known channel values: ? ? ? ? ? ? ? ? ? ? ? ? ? ? ? *? ? |||? ? ?| ?| ?| ?| ? ? ? ? ? ? ? ? ? ? ? ?| ?| ?| ?| ? ?| ?| ? ? ? ? Avoid using loops! Instead, use the imfilter function (filter2 or conv2 work just as well). The above method, being very simple, does not work perfectly. You can see where it makes mistakes by computing a map of squared differences between original and reconstructed values for each pixel, summed over the three color channels. Compute such a map and display it using the following commands: imagesc(I_diff); colormap (jet); colorbar % I_diff is the difference image In addition, compute and display the average and maximum of the per-pixel squared differences for the image. Finally, show a close-up of some patch of the reconstructed image where the artifacts are particularly apparent and explain the cause of these artifacts. 2012 Part 1: Linear Interpolation Implement a very simple linear interpolation approach to demosaicing: for each pixel, fill in the two missing channels by averaging either the four or the two neighboring known channel values: ? ? ? ? ? ? ? ? ? ? ? ? ? ? ? *? ? |||? ? ?| ?| ?| ?| ? ? ? ? ? ? ? ? ? ? ? ?| ?| ?| ?| ? ?| ?| ? ? ? ? Avoid using loops! Instead, use the imfilter function (filter2 or conv2 work just as well). The above method, being very simple, does not work perfectly. You can see where it makes mistakes by computing a map of squared differences between original and reconstructed values for each pixel, summed over the three color channels. Compute such a map and display it using the following commands: imagesc(I_diff); colormap (jet); colorbar % I_diff is the difference image In addition, compute and display the average and maximum of the per-pixel squared differences for the image. Finally, show a close-up of some patch of the reconstructed image where the artifacts are particularly apparent and explain the cause of these artifacts. 2012
Step by Step Solution
There are 3 Steps involved in it

Get step-by-step solutions from verified subject matter experts