

Question: Create a 3-D pie chart from the selected/data. begin{tabular}{|c|c|c|c|c|c|} hline A & 8 & & c & D & E hline & Salaries 2019

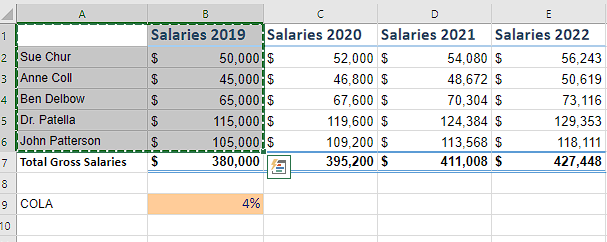
Create a 3-D pie chart from the selected/data. \begin{tabular}{|c|c|c|c|c|c|} \hline A & 8 & & c & D & E \\ \hline & Salaries 2019 & Sala & s 2020 & Salaries 2021 & Salaries 2022 \\ \hline Sue Chur & 50,000 & $ & 52,000 & 54,080 & 56,243 \\ \hline Anne Coll & 45,000 & $ & 46,800 & 48,672 & 50,619 \\ \hline Ben Delbow & 65,000 & $ & 67,600 & 70,304 & 73,116 \\ \hline Dr. Patella & 115,000 & $ & 119,600 & 124,384 & 129,353 \\ \hline John Patterson & 105,000 & $ & 109,200 & 113,568 & 118,111 \\ \hline Total Gross Salaries & 380,000 & & 395,200 & 411,008 & 427,448 \\ \hline & & & & & \\ \hline COLA & 4% & & & & \\ \hline & & & & & \\ \hline \end{tabular}
Step by Step Solution
There are 3 Steps involved in it

Get step-by-step solutions from verified subject matter experts