

Question: Create a bar graph with this table Year 2010 2011 2012 2013 2014 2015 2016 2017 2018 2019 2020 2021 Total, all educational attainment levels
Create a bar graph with this table
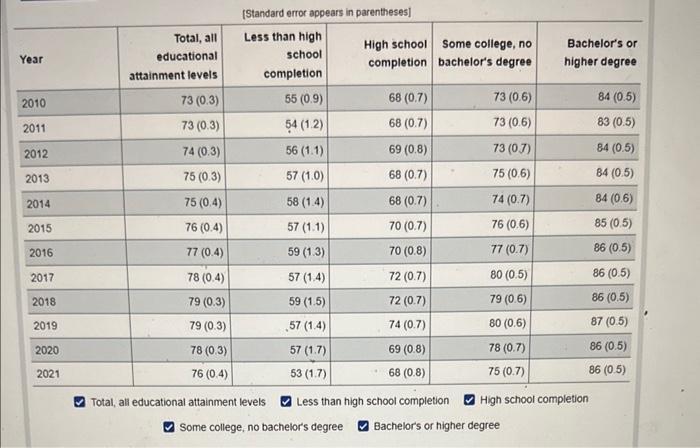
Year 2010 2011 2012 2013 2014 2015 2016 2017 2018 2019 2020 2021 Total, all educational attainment levels 73 (0.3) 73 (0.3) 74 (0.3) 75 (0.3) 75 (0.4) 76 (0.4) 77 (0.4) (Standard error appears in parentheses] Less than high school completion 55 (0.9) 54 (1.2) 56 (1.1) 57 (1.0) 58 (1.4) 57 (1.1) 59 (1.3) 57 (1.4) 59 (1.5) 57 (1.4) 57 (1.7) 53 (1.7) 78 (0.4) 79 (0.3) 79 (0.3) 78 (0.3) 76 (0.4) Total, all educational attainment levels Some college, no bachelor's degree Some college, no High school completion bachelor's degree 68 (0.7) 68 (0.7) 69 (0.8) 68 (0.7) 68 (0.7) 70 (0.7) 70 (0.8) 72 (0.7) 72 (0.7) 74 (0.7) 69 (0.8) 68 (0.8) 73 (0.6) 73 (0.6) 73 (0.7) 75 (0.6) 74 (0.7) 76 (0.6) 77 (0.7) 80 (0.5) 79 (0.6) 80 (0.6) 78 (0.7) 75 (0.7) Bachelor's or higher degree Less than high school completion Bachelor's or higher degree High school completion 84 (0.5) 83 (0.5) 84 (0.5) 84 (0.5) 84 (0.6) 85 (0.5) 86 (0.5) 86 (0.5) 86 (0.5) 87 (0.5) 86 (0.5) 86 (0.5)
Step by Step Solution
3.51 Rating (148 Votes )
There are 3 Steps involved in it
NB The Clustered Bar graph is generated using Microsoft Excel by using the ... View full answer

Get step-by-step solutions from verified subject matter experts