Use the dividend discount model to value a share of Toyotas stock (ticker symbol: TM) as of
Question:
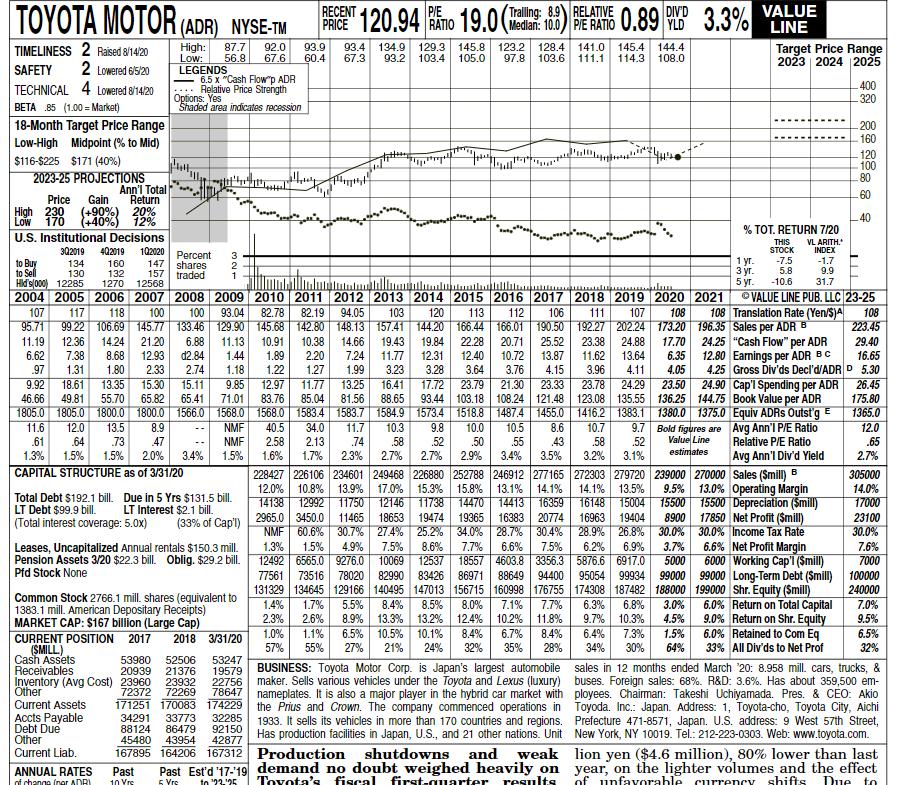
Use the dividend discount model to value a share of Toyota’s stock (ticker symbol: TM) as of December 31, 2021. In your application of this model, use the data provided on the most recent Toyota Value Line report (history of their annual dividend payments, forecasts of future annual dividend payments, past and forecasted growth rates in dividends, and Value Line’s estimate of Toyota’s equity beta). Given all the dividend data (historic and forecasted) presented in the Value Line report, explain, in one sentence, the logic you used to estimate the expected future constant growth rate in dividends in perpetuity (g). Since Toyota is a non-US firm, dividends per share on Value Line are referred to as Gross Dividends Declared per ADR. On direction on how to access Value line report, explain in one sentence, the logic you to estimate the expected future constant growth rate in dividend in perpetuity(g)
ΤΟΥΟΤΑ ΜΟΤOR DR NYSEm DIV'D PRICE" 120,94 RATIO 19.0 (Median: 10.0) PIE RATIO 0.89 YLD PACE" 120,94 Ano 19.0 ( 100) E ANE 0.89 PD 3.3% PIE Tralling: 8.9 RELATIVE VALUE LINE TIMELINESS 2 Raised a/14/20 2 Lowered 65/20 TECHNICAL 4 Lowered 8'14/20 High: Low: LEGENDS 6.5 x "Cash Flow"p ADR Relative Price Strength Options: Yes Shaded area indicates recession 87.7 56.8 92.0 67.6 134.9 129.3 93.2 103.4 145.8 123.2 97.8 105.0 144.4 108.0 93.9 93.4 67.3 128.4 103.6 141.0 111.1 145.4 114.3 Target Price Range 2023 2024 |2025 60.4 SAFETY 400 320 BETA 85 (1.00 = Market) 18-Month Target Price Range 200 160 Low-High Midpoint (% to Mid) 120 100 80 $116-$225 $171 (40%) 2023-25 PROJECTIONS Ann'l Total Return (+90%) 20% u' Y 60 Price Gain High 230 Low 170 40 % TOT. RETURN 7/20 U.S. Institutional Decisions THIS STOCK VL ARITH. INDEX 302019 402019 102020 Percent 147 shares 157 traded 1 yr. з уг. 5 yr. -7.5 5.8 -10.6 to Buy to Self Hid's(000) 12285 134 130 160 132 1270 -1.7 9.9 12568 31.7 2004 2005 2006 2007 2008 2009 2010 2011 2012 2013 2014 2015 2016 2017 2018 2019 2020 2021 OVALUE LINE PUB. LLC 23-25 108 Translation Rate (Yen/S)A 99.22 106.69 145.77 133.46 129.90 145.68 142.80 148.13 157.41 144.20 166.44 166.01 190.50 192.27 202.24 173.20 196.35 Sales per ADR B 24.25 "Cash Flow" per ADR 12.80 Earnings per ADR BC 107 117 118 100 100 93.04 82.78 82.19 94.05 103 120 113 112 106 111 107 108 108 95.71 223.45 12.36 11.13 22.28 20.71 10.72 11.19 14.24 21.20 6.88 10.91 10.38 14.66 19.43 19.84 25.52 23.38 24.88 17.70 29.40 6.62 7.38 8.68 12.93 d2.84 1.44 1.89 2.20 7.24 11.77 12.31 12.40 13.87 11.62 13.64 6.35 16.65 .97 1.31 1.80 2.33 2.74 1.18 1.22 1.27 1.99 3.23 3.28 3.64 3.76 4.15 3.96 4.11 4.05 4.25 Gross Div'ds Decl'd/ADR D 5.30 24.90 Cap'l Spending per ADR 93.44 103.18 108.24 121.48 123.08 135.55 136.25 144.75 Book Value per ADR 1805.0 1805.0 1800.0 1800.0 1566.0 1568.0 1568.0 1583.4 1583.7 1584.9 1573.4 1518.8 1487.4 1455.0 1416.2 1383.1 1380.0 1375.0 Equiv ADRS Outst'g E 9.7 Bold figures are Avg Ann'l P/E Ratio Relative P/E Ratio 9.92 18.61 13.35 15.30 15.11 9.85 12.97 11.77 13.25 16.41 17.72 23.79 21.30 23.33 23.78 24.29 23.50 26.45 46.66 49.81 55.70 65.82 65.41 71.01 83.76 85.04 81.56 88.65 175.80 1365.0 11.6 12.0 13.5 8.9 NMF 40.5 34.0 11.7 10.3 9.8 10.0 10.5 8.6 10.7 12.0 NMF 1.5% Value Line estimates .61 .64 73 47 2.58 2.13 74 .58 .52 .50 .55 43 .58 .52 .65 1.3% 1.5% 1.5% 2.0% 3.4% 1.6% 1.7% 2.3% 2.7% 2.7% 2.9% 3.4% 3.5% 3.2% 3.1% Avg Ann'I Div'd Yleld 2.7% CAPITAL STRUCTURE as of 3/31/20 228427 226106 234601 249468 226880 252788 246912 277165 272303 279720239000 270000 Sales (Smill) B 305000 12.0% 10.8% 13.9% 17.0% 15.3% 15.8% 13.1% 14.1% 12146 18653 NMF 60.6% 30.7% 274% 25.2% 34.0% 28.7% 30.4% 13.0% Operating Margin 15500 Depreciation ($mill) 17850 Net Profit (Smill) 28.9% 26.8% 30.0% 30.0% Income Tax Rate 6.6% Net Profit Margin 6000 Working Cap'I ($mill) 99000 Long-Term Debt (Smil) 14.1% 13.5% 9.5% 14.0% Total Debt $192.1 bill. Due in 5 Yrs $131.5 bill. LT Debt $99.9 bill. (Total interest coverage: 5.0x) 14138 12992 11750 11738 14470 14413 16359 16148 15004 15500 LT Interest $2.1 bill. (33% of Capi) 17000 23100 30.0% 2965.0 3450.0 11465 19474 19365 16383 20774 16963 19404 8900 6.9% 12492 6565.0 9276.0 10069 12537 18557 4603.8 3356.3 5876.6 6917.0 95054 99934 1.3% 1.5% 4.9% 7.5% 8.6% 7.7% 6.6% 7.5% 6.2% 3.7% 7.6% Leases, Uncapitalized Annual rentals $150.3 mill. Pension Assets 3/20 $22.3 bill. Oblig. $29.2 bill. Pfd Stock None 5000 7000 86971 88649 94400 131329 134645129166 140495147013 156715 160998 176755 174308 187482 188000 199000 Shr. Equity (Smill 77561 73516 78020 82990 83426 99000 100000 240000 Common Stock 2766.1 mill. shares (equivalent to 1383.1 mill. American Depositary Receipts) MARKET CAP: $167 billion (Large Cap) 6.0% Return on Total Capital 9.0% Return on Shr. Equity 6.0% Retained to Com Eq 1.4% 1.7% 5.5% 8.4% 8.5% 8.0% 7.1% 7.7% 6.3% 6.8% 3.0% 7.0% 8.9% 13.3% 13.2% 6.5% 10.5% 10.1% 2.3% 2.6% 12.4% 10.2% 11.8% 9.7% 10.3% 4.5% 9.5% 6.4% 1.0% 57% 1.1% 8.4% 6.7% 8.4% 7.3% 1.5% 6.5% CURRENT POSITION 2017 (SMILL) Cash Assets Receivables Inventory (Avg Cost) 23960 Other Current Assets 2018 3/31/20 55% 27% 21% 24% 32% 35% 28% 34% 30% 64% 33% All Div'ds to Net Prof 32% 52506 21376 23932 72372 72269 171251 170083 174229 53980 20939 53247 19579 22756 sales in 12 months ended March '20: 8.958 mill. cars, trucks, & maker. Sells various vehicles under the Toyota and Lexus (luxury) buses. Foreign sales: 68%. R&D: 3.6%. Has about 359,500 em- 78647 nameplates. It is also a major player in the hybrid car market with ployees. Chairman: Takeshi Uchiyamada. Pres. & CEO: Akio the Prius and Crown. The company commenced operations in Toyoda. Inc.: Japan. Address: 1, Toyota-cho, Toyota City, Aichi 1933. It sells its vehicles in more than 170 countries and regions. Prefecture 471-8571, Japan. U.S. address: 9 West 57th Street, Has production facilities in Japan, U.S., and 21 other nations. Unit New York, NY 10019. Tel.: 212-223-0303. Web: www.toyota.com. BUSINESS: Toyota Motor Corp. is Japan's largest automobile Accts Payable Debt Dué Other Current Liab. 34291 88124 45480 33773 86479 43954 32285 92150 42877 167895 164206 167312 Production shutdowns and weak lion yen ($4.6 million), 80% lower than last ANNUAL RATES of change (nor ADRI Past Est'd '17-'19 demand no doubt weighed heavily on 5 Yre year, on the lighter volumes and the effect Due to Past Toyota's fiscal first-quarter results of unfavorable currency shifts 10 Vre to 23.'25 321 ΤΟΥΟΤΑ ΜΟΤOR DR NYSEm DIV'D PRICE" 120,94 RATIO 19.0 (Median: 10.0) PIE RATIO 0.89 YLD PACE" 120,94 Ano 19.0 ( 100) E ANE 0.89 PD 3.3% PIE Tralling: 8.9 RELATIVE VALUE LINE TIMELINESS 2 Raised a/14/20 2 Lowered 65/20 TECHNICAL 4 Lowered 8'14/20 High: Low: LEGENDS 6.5 x "Cash Flow"p ADR Relative Price Strength Options: Yes Shaded area indicates recession 87.7 56.8 92.0 67.6 134.9 129.3 93.2 103.4 145.8 123.2 97.8 105.0 144.4 108.0 93.9 93.4 67.3 128.4 103.6 141.0 111.1 145.4 114.3 Target Price Range 2023 2024 |2025 60.4 SAFETY 400 320 BETA 85 (1.00 = Market) 18-Month Target Price Range 200 160 Low-High Midpoint (% to Mid) 120 100 80 $116-$225 $171 (40%) 2023-25 PROJECTIONS Ann'l Total Return (+90%) 20% u' Y 60 Price Gain High 230 Low 170 40 % TOT. RETURN 7/20 U.S. Institutional Decisions THIS STOCK VL ARITH. INDEX 302019 402019 102020 Percent 147 shares 157 traded 1 yr. з уг. 5 yr. -7.5 5.8 -10.6 to Buy to Self Hid's(000) 12285 134 130 160 132 1270 -1.7 9.9 12568 31.7 2004 2005 2006 2007 2008 2009 2010 2011 2012 2013 2014 2015 2016 2017 2018 2019 2020 2021 OVALUE LINE PUB. LLC 23-25 108 Translation Rate (Yen/S)A 99.22 106.69 145.77 133.46 129.90 145.68 142.80 148.13 157.41 144.20 166.44 166.01 190.50 192.27 202.24 173.20 196.35 Sales per ADR B 24.25 "Cash Flow" per ADR 12.80 Earnings per ADR BC 107 117 118 100 100 93.04 82.78 82.19 94.05 103 120 113 112 106 111 107 108 108 95.71 223.45 12.36 11.13 22.28 20.71 10.72 11.19 14.24 21.20 6.88 10.91 10.38 14.66 19.43 19.84 25.52 23.38 24.88 17.70 29.40 6.62 7.38 8.68 12.93 d2.84 1.44 1.89 2.20 7.24 11.77 12.31 12.40 13.87 11.62 13.64 6.35 16.65 .97 1.31 1.80 2.33 2.74 1.18 1.22 1.27 1.99 3.23 3.28 3.64 3.76 4.15 3.96 4.11 4.05 4.25 Gross Div'ds Decl'd/ADR D 5.30 24.90 Cap'l Spending per ADR 93.44 103.18 108.24 121.48 123.08 135.55 136.25 144.75 Book Value per ADR 1805.0 1805.0 1800.0 1800.0 1566.0 1568.0 1568.0 1583.4 1583.7 1584.9 1573.4 1518.8 1487.4 1455.0 1416.2 1383.1 1380.0 1375.0 Equiv ADRS Outst'g E 9.7 Bold figures are Avg Ann'l P/E Ratio Relative P/E Ratio 9.92 18.61 13.35 15.30 15.11 9.85 12.97 11.77 13.25 16.41 17.72 23.79 21.30 23.33 23.78 24.29 23.50 26.45 46.66 49.81 55.70 65.82 65.41 71.01 83.76 85.04 81.56 88.65 175.80 1365.0 11.6 12.0 13.5 8.9 NMF 40.5 34.0 11.7 10.3 9.8 10.0 10.5 8.6 10.7 12.0 NMF 1.5% Value Line estimates .61 .64 73 47 2.58 2.13 74 .58 .52 .50 .55 43 .58 .52 .65 1.3% 1.5% 1.5% 2.0% 3.4% 1.6% 1.7% 2.3% 2.7% 2.7% 2.9% 3.4% 3.5% 3.2% 3.1% Avg Ann'I Div'd Yleld 2.7% CAPITAL STRUCTURE as of 3/31/20 228427 226106 234601 249468 226880 252788 246912 277165 272303 279720239000 270000 Sales (Smill) B 305000 12.0% 10.8% 13.9% 17.0% 15.3% 15.8% 13.1% 14.1% 12146 18653 NMF 60.6% 30.7% 274% 25.2% 34.0% 28.7% 30.4% 13.0% Operating Margin 15500 Depreciation ($mill) 17850 Net Profit (Smill) 28.9% 26.8% 30.0% 30.0% Income Tax Rate 6.6% Net Profit Margin 6000 Working Cap'I ($mill) 99000 Long-Term Debt (Smil) 14.1% 13.5% 9.5% 14.0% Total Debt $192.1 bill. Due in 5 Yrs $131.5 bill. LT Debt $99.9 bill. (Total interest coverage: 5.0x) 14138 12992 11750 11738 14470 14413 16359 16148 15004 15500 LT Interest $2.1 bill. (33% of Capi) 17000 23100 30.0% 2965.0 3450.0 11465 19474 19365 16383 20774 16963 19404 8900 6.9% 12492 6565.0 9276.0 10069 12537 18557 4603.8 3356.3 5876.6 6917.0 95054 99934 1.3% 1.5% 4.9% 7.5% 8.6% 7.7% 6.6% 7.5% 6.2% 3.7% 7.6% Leases, Uncapitalized Annual rentals $150.3 mill. Pension Assets 3/20 $22.3 bill. Oblig. $29.2 bill. Pfd Stock None 5000 7000 86971 88649 94400 131329 134645129166 140495147013 156715 160998 176755 174308 187482 188000 199000 Shr. Equity (Smill 77561 73516 78020 82990 83426 99000 100000 240000 Common Stock 2766.1 mill. shares (equivalent to 1383.1 mill. American Depositary Receipts) MARKET CAP: $167 billion (Large Cap) 6.0% Return on Total Capital 9.0% Return on Shr. Equity 6.0% Retained to Com Eq 1.4% 1.7% 5.5% 8.4% 8.5% 8.0% 7.1% 7.7% 6.3% 6.8% 3.0% 7.0% 8.9% 13.3% 13.2% 6.5% 10.5% 10.1% 2.3% 2.6% 12.4% 10.2% 11.8% 9.7% 10.3% 4.5% 9.5% 6.4% 1.0% 57% 1.1% 8.4% 6.7% 8.4% 7.3% 1.5% 6.5% CURRENT POSITION 2017 (SMILL) Cash Assets Receivables Inventory (Avg Cost) 23960 Other Current Assets 2018 3/31/20 55% 27% 21% 24% 32% 35% 28% 34% 30% 64% 33% All Div'ds to Net Prof 32% 52506 21376 23932 72372 72269 171251 170083 174229 53980 20939 53247 19579 22756 sales in 12 months ended March '20: 8.958 mill. cars, trucks, & maker. Sells various vehicles under the Toyota and Lexus (luxury) buses. Foreign sales: 68%. R&D: 3.6%. Has about 359,500 em- 78647 nameplates. It is also a major player in the hybrid car market with ployees. Chairman: Takeshi Uchiyamada. Pres. & CEO: Akio the Prius and Crown. The company commenced operations in Toyoda. Inc.: Japan. Address: 1, Toyota-cho, Toyota City, Aichi 1933. It sells its vehicles in more than 170 countries and regions. Prefecture 471-8571, Japan. U.S. address: 9 West 57th Street, Has production facilities in Japan, U.S., and 21 other nations. Unit New York, NY 10019. Tel.: 212-223-0303. Web: www.toyota.com. BUSINESS: Toyota Motor Corp. is Japan's largest automobile Accts Payable Debt Dué Other Current Liab. 34291 88124 45480 33773 86479 43954 32285 92150 42877 167895 164206 167312 Production shutdowns and weak lion yen ($4.6 million), 80% lower than last ANNUAL RATES of change (nor ADRI Past Est'd '17-'19 demand no doubt weighed heavily on 5 Yre year, on the lighter volumes and the effect Due to Past Toyota's fiscal first-quarter results of unfavorable currency shifts 10 Vre to 23.'25 321
Expert Answer:
In disunted sh flw DF vlutin tehniques the vlue f the stk is estimte... View the full answer
Corporate Finance
ISBN: 978-0077861759
10th edition
Authors: Stephen Ross, Randolph Westerfield, Jeffrey Jaffe
Students also viewed these corporate finance questions
-
In practice, a common way to value a share of stock when a company pays dividends is to value the dividends over the next five years or so, then find the terminal stock price using a benchmark PE...
-
Explain the idea behind the Dividend Discount Model (DDM).
-
In practice, a common way to value a share of stock when a company pays dividends is to value the dividends over the next five years or so, then find the "terminal" stock price using a benchmark PE...
-
The Louisiana Grill The Louisiana Grill (TLG) is a restaurant in Toronto. TLG is a regional restaurant created and operated by Alex Ven- tresca, a former football player from New Orleans. The company...
-
A French institutional investor wishes to decrease its exposure to Taiwan. It is interested in selling 20,000 shares of a particular Taiwanese firm that is currently in its portfolio. This firm...
-
Questions 3-6 refer to the following passage. The author refers to James Fenimore Cooper and Willa Cather in order to suggest a. That their works are examples of entertaining literature b. That their...
-
Ohio Logistics manages the logistical activities for firms by matching companies that need products shipped with carriers that can provide the best rates and best service for the companies. Ohio...
-
The Sanchez Computer Center created its chart of accounts as follows: You will use this chart of accounts to complete the Continuing Problem. The following problem continues from Chapter 1. The...
-
The graph below is the function f(x) 4- 3 2 + -5 4-3-2-1 12 + -2 -3 Find lim f(x) 2-2 Find lim f(x) 2-2+ Find lim f(x) 2-2 Find f(2)
-
The Bayview Resort has three operating departmentsthe Convention Center, Food Services, and Guest Lodgingthat are supported by three service departments General Administration, Cost Accounting, and...
-
How do marketers tie profits to specific channels to see that they are providing an ROI? Are there certain channels that have proven to more effective than others, or do you thing it depends on the...
-
Mr. Johnson, a Texas insurance agent, is replacing an annuity for Mrs. Benson. He presents the notice regarding replacement electronically. Both Mrs. Benson and Mr. Johnson sign the notice...
-
Two cars are moving in the same direction. They have accelerations a = 4.0 and = 6.0. Based on this information, select the correct answers. a. The car with the larger acceleration travels a larger...
-
You loan a friend $5,000. There is a 15% chance your friend will pay you a 3% return, a 40% chance he will pay you a 2% return and a 45% chance he will pay you only a 1% return. What is your expected...
-
A car was moving at a speed of 7 5 mph for the first 4 miles and then continued move for another 4 miles at a speed of 3 0 mph . What is the average speed of the car?
-
For adult the RDA of the amino acid lysine is 1 2 mg per kg of body weight. How many grams per day should a 7 1 . 0 kg adult receive?
-
Q3: Leap Year Determination <8 points> Use the Gregorian approach to determine whether a given year is a leap year. Here are the conditions: Determine whether the year is divisible by 100. If it is,...
-
The following cost information was provided to you for analysis: September 12,000 Units Produced Costs: TIC TAC TOE TING August 10,000 P80,000 70.000 60.000 50,000 How much is the fixed cost per...
-
You are saving for the college education of your two children. They are two years apart in age; one will begin college 15 years from today and the other will begin 17 years from today. You estimate...
-
When should a firm force conversion of convertibles? Why?
-
If the market places the same value on $1 of dividends as on $1 of capital gains, then firms with different payout ratios will appeal to different clienteles of investors. One clientele is as good as...
-
Using the potential theory obtain the damping for a cycle of (i) plunge, (ii) pitch oscillations.
-
Consider a delta wing with sweep angle \(\Lambda\). Show that the expressions 8.11 and 8.12 give the same lift line slope for the delta wing. Eq 8.11 Eq 8.12 = CD CD+CL tan
-
Using the Polhamus theory obtain the drag polar for a delta wing with sweep angle \(75^{\circ}\).
Study smarter with the SolutionInn App