

Question: Create a Capacity Analysis bubble chart based on the data provided in Capsim. Production Costs Activity Use the table below with page 4 of the
Create a Capacity Analysis bubble chart based on the data provided in Capsim.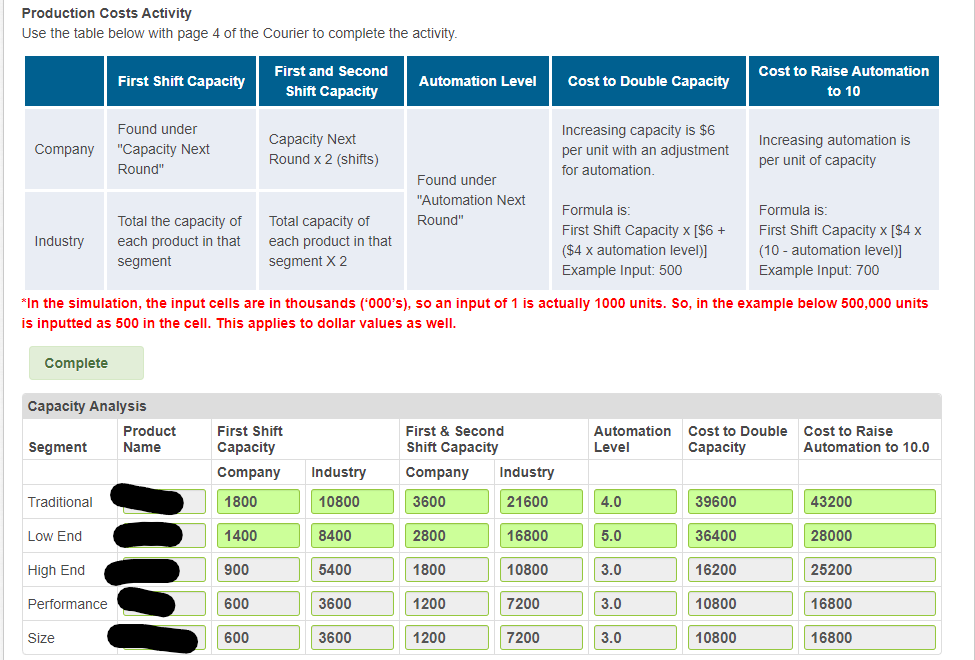
Step by Step Solution
There are 3 Steps involved in it
1 Expert Approved Answer
Step: 1 Unlock

Question Has Been Solved by an Expert!
Get step-by-step solutions from verified subject matter experts
Step: 2 Unlock
Step: 3 Unlock