

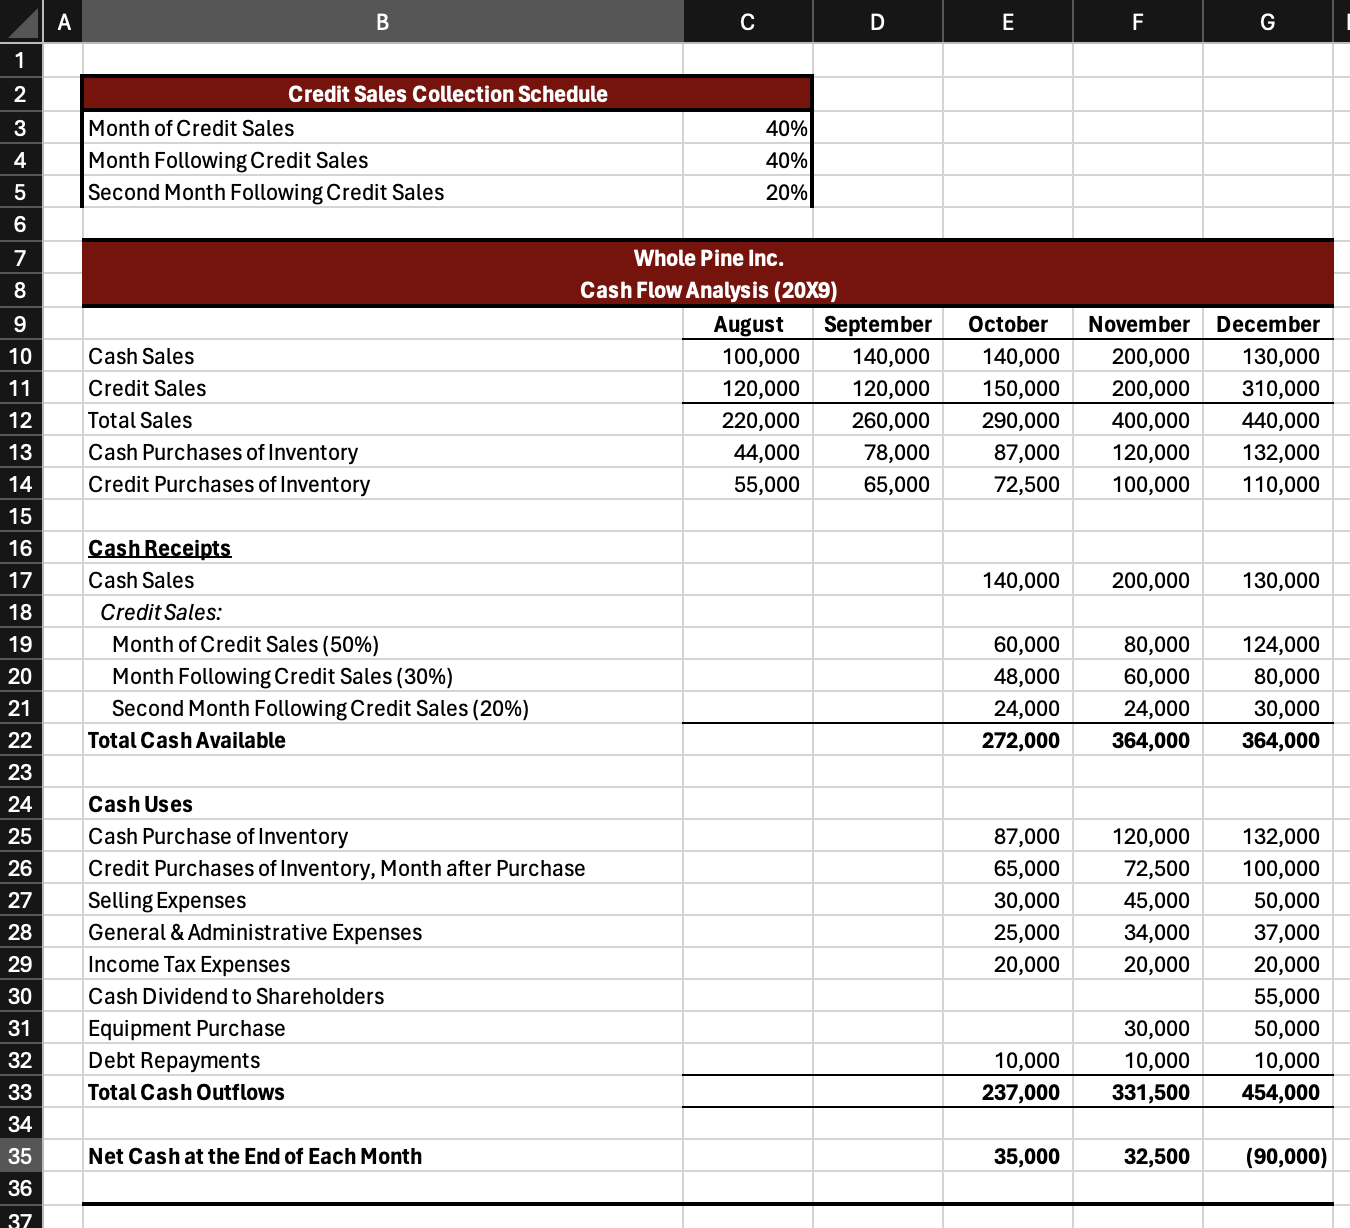
Question: Create a column chart that shows net cash for each month from October through December. a . Title the chart Net Cash Flows. b .

Create a column chart that shows net cash for each month from October through December.
a Title the chart "Net Cash Flows".
b The primary horizontal axis should be months range E:G and the primary vertical axis should be dollar amounts.
c Do not show the legend in the chart.
d Show the data label for each column on the outside end.
e Place the chart in the designated area.
Step by Step Solution
There are 3 Steps involved in it
1 Expert Approved Answer
Step: 1 Unlock

Question Has Been Solved by an Expert!
Get step-by-step solutions from verified subject matter experts
Step: 2 Unlock
Step: 3 Unlock