

Question: Create a line chart for the closing prices for all years and a stock chart for the high/low/close prices for 2011 through 2012 in the
Create a line chart for the closing prices for all years and a stock chart for the high/low/close prices for 2011 through 2012 in the accompanying S&P 500 data.
| Date | Open | High | Low | Close |
|
|---|---|---|---|---|---|
| 10/3/2007 | 1533.99 | 1545.84 | 1536.34 | 1544.3 | |
| 1/15/2008 | 1397.73 | 1406.52 | 1380.60 | 1405.82 | |
| 5/2/2008 | 1406.08 | 1422.72 | 1407.25 | 1417.13 | |
| 8/19/2008 | 1270.18 | 1276.65 | 1263.11 | 1266.99 | |
| 12/4/2008 | 855.96 | 875.60 | 833.60 | 852.38 | |
| 3/25/2009 | 811.83 | 1411.33 | 791.37 | 1094.83 | |
| 7/13/2009 | 883.48 | 901.05 | 877.96 | 894.02 | |
| 10/27/2009 | 1069.21 | 1072.48 | 1060.62 | 1066.49 | |
| 2/16/2010 | 1079.13 | 1095.67 | 1079.13 | 1093.45 | |
| 6/3/2010 | 1098.82 | 1105.67 | 1094.33 | 1098.4 | |
| 9/20/2010 | 1126.57 | 1140.95 | 1126.57 | 1131.79 | |
| 1/4/2011 | 1272.95 | 1274.12 | 1262.66 | 1266.07 | |
| 4/21/2011 | 1333.38 | 1337.49 | 1332.83 | 1332.9 | |
| 8/9/2011 | 1120.23 | 1172.88 | 1101.54 | 1127.47 | |
| 11/23/2011 | 1187.48 | 1190.82 | 1163.12 | 1181.73 | |
| 3/14/2012 | 1395.95 | 1399.42 | 1389.97 | 1390.28 | |
| 6/29/2012 | 1330.12 | 1362.17 | 1330.12 | 1355.39 | |
| 10/16/2012 | 1440.31 | 1455.51 | 1440.31 | 1454.7 | |
| 2/6/2013 | 1511.25 | 1518.86 | 1504.71 | 1509.13 | |
| 5/24/2013 | 1646.67 | 1649.78 | 1636.88 | 1643.46 | |
| 8/30/2013 | 1638.89 | 1640.08 | 1630.79 | 1633.66 |
Choose the correct stock chart for the high/low/close prices for 2011 through 2012.
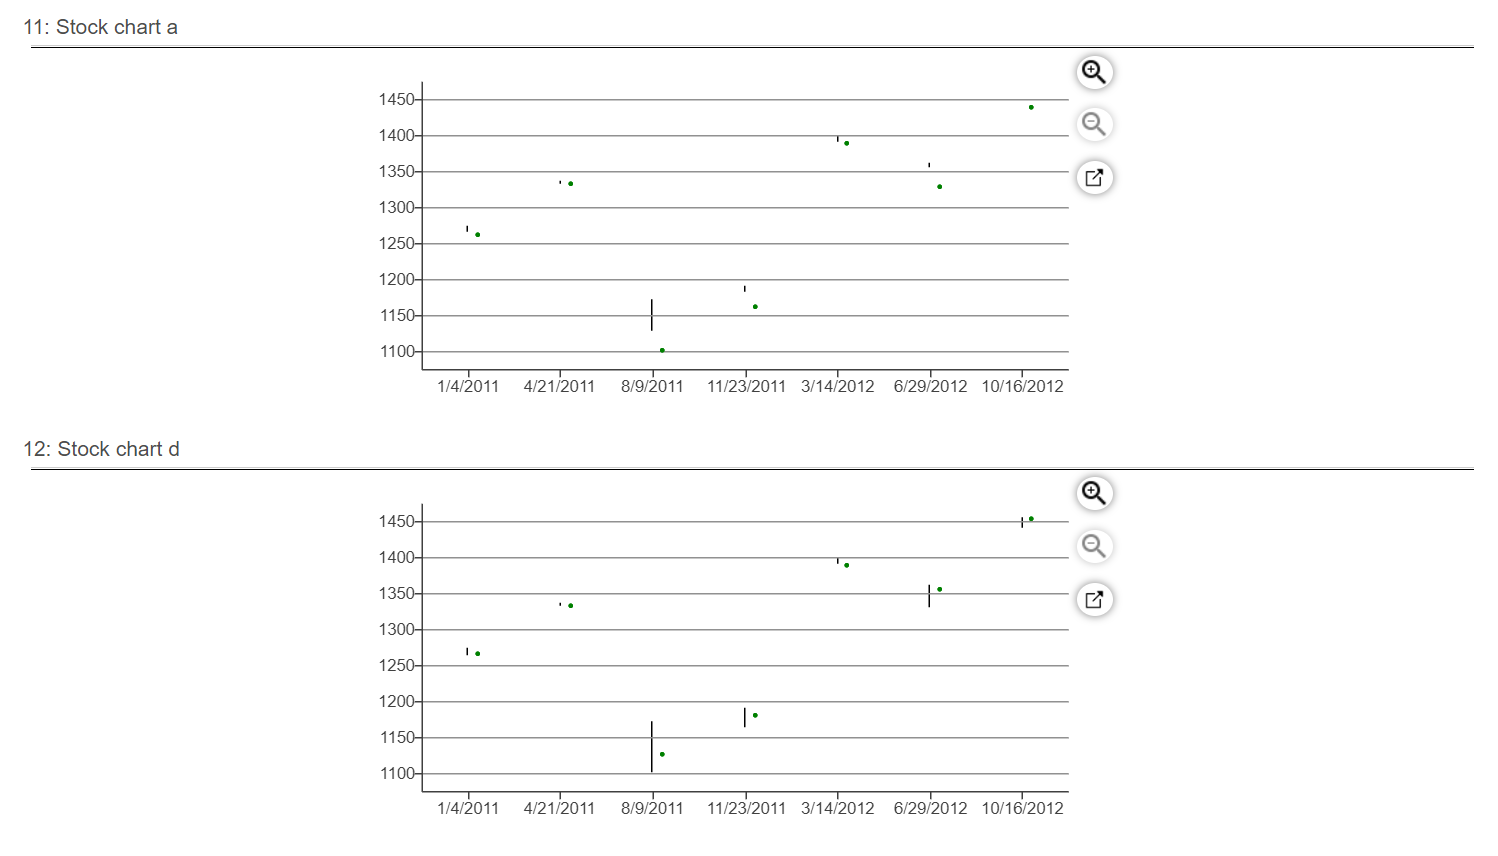
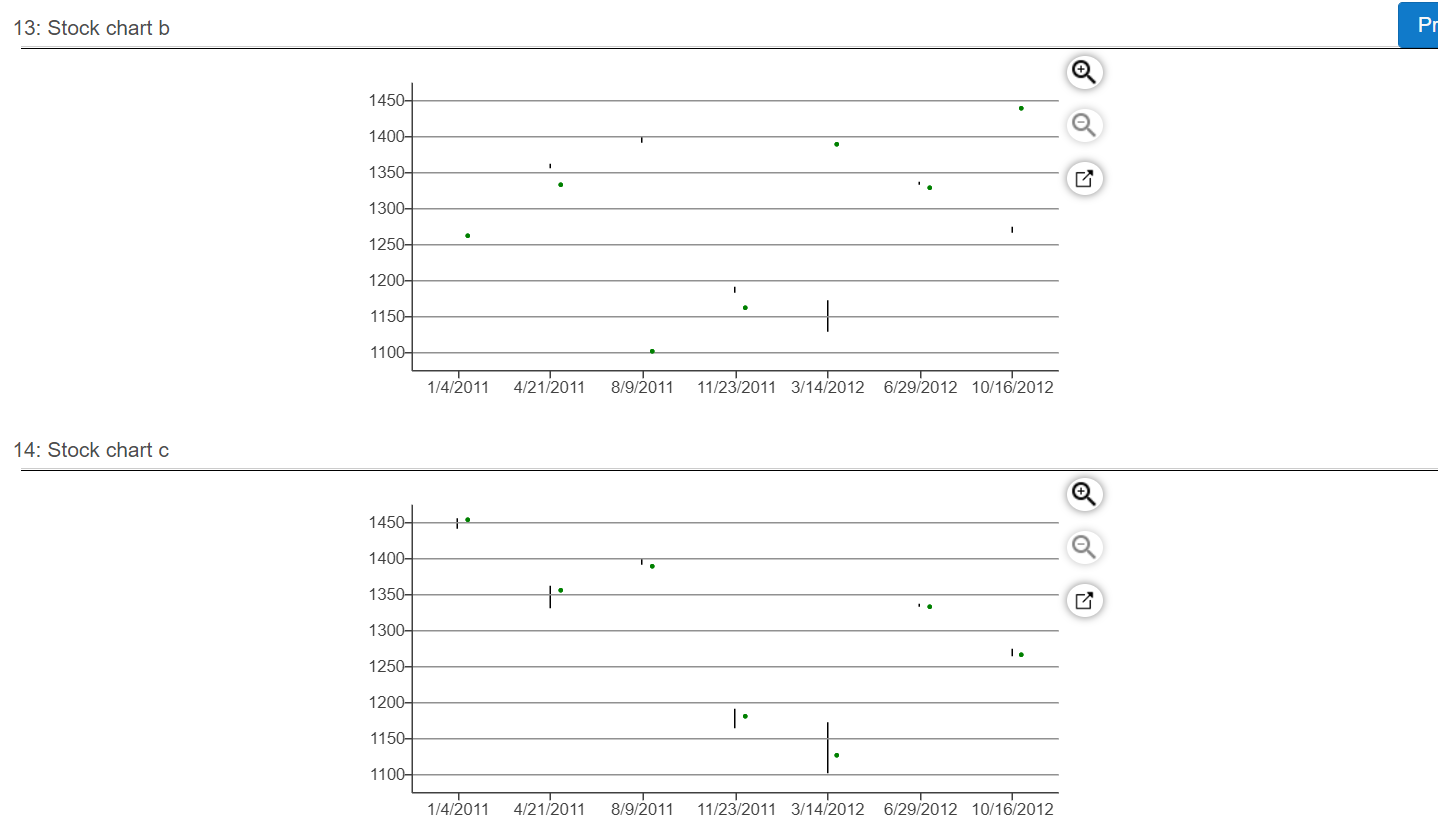
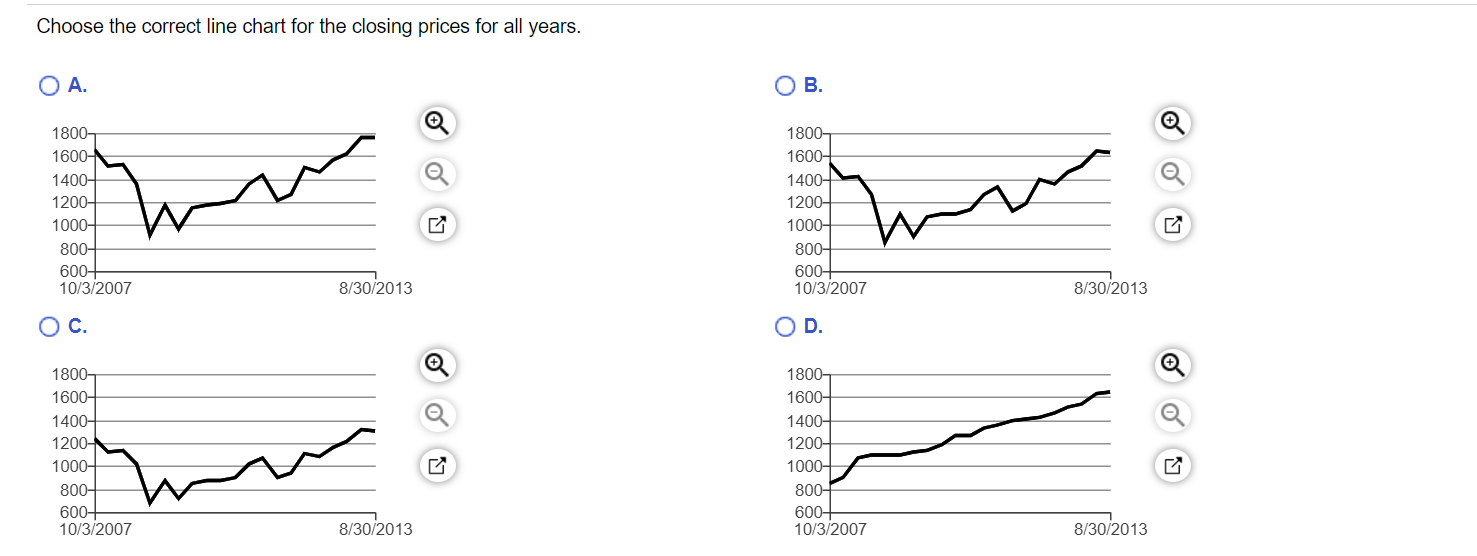
Choose the correct line chart for the closing prices for all years. 11: Stock chart a 12: Stock chart d 13: Stock chart b 14: Stock chart c
Step by Step Solution
There are 3 Steps involved in it

Get step-by-step solutions from verified subject matter experts